The features that set NEURU apart.
A traditional NMS shows you a red light and stops there. A handful of NEURU's tools go further — they investigate, simulate, and act. These are the ones teams tell us made them switch.
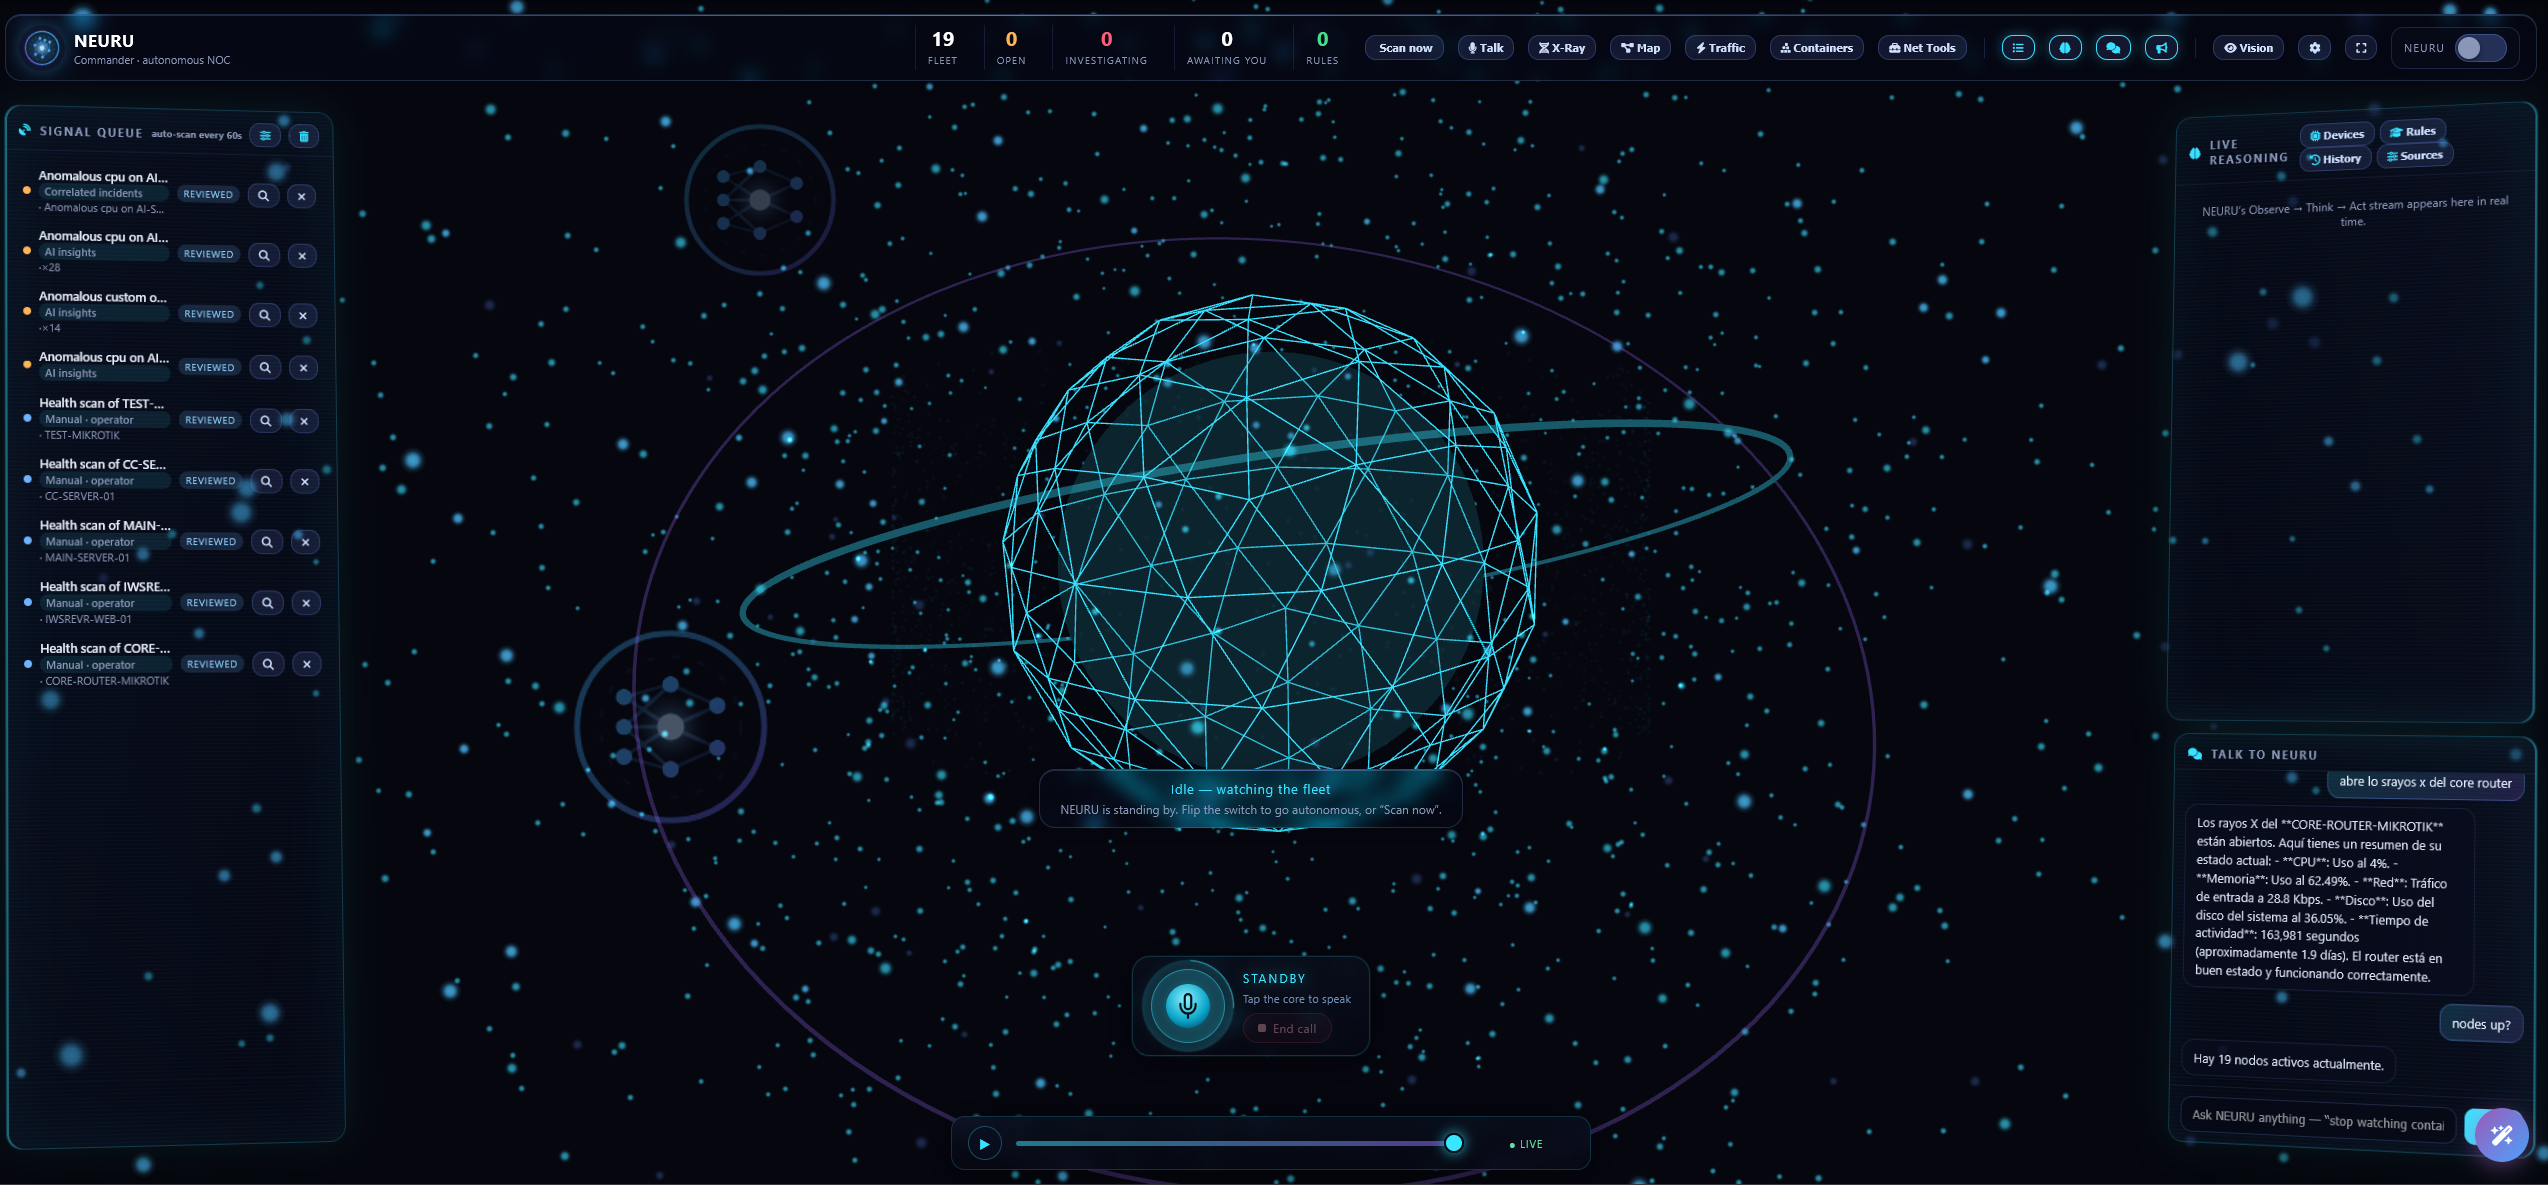
An autonomous AI operator that continuously watches the exact devices you pick, reasons about what it sees, and takes action on your behalf. Three levels of autonomy — Observe, Co-pilot, Autopilot — plus one-tap Telegram approvals and a complete audit trail. Monitoring that actually does something about what it finds.
✦ Signature capability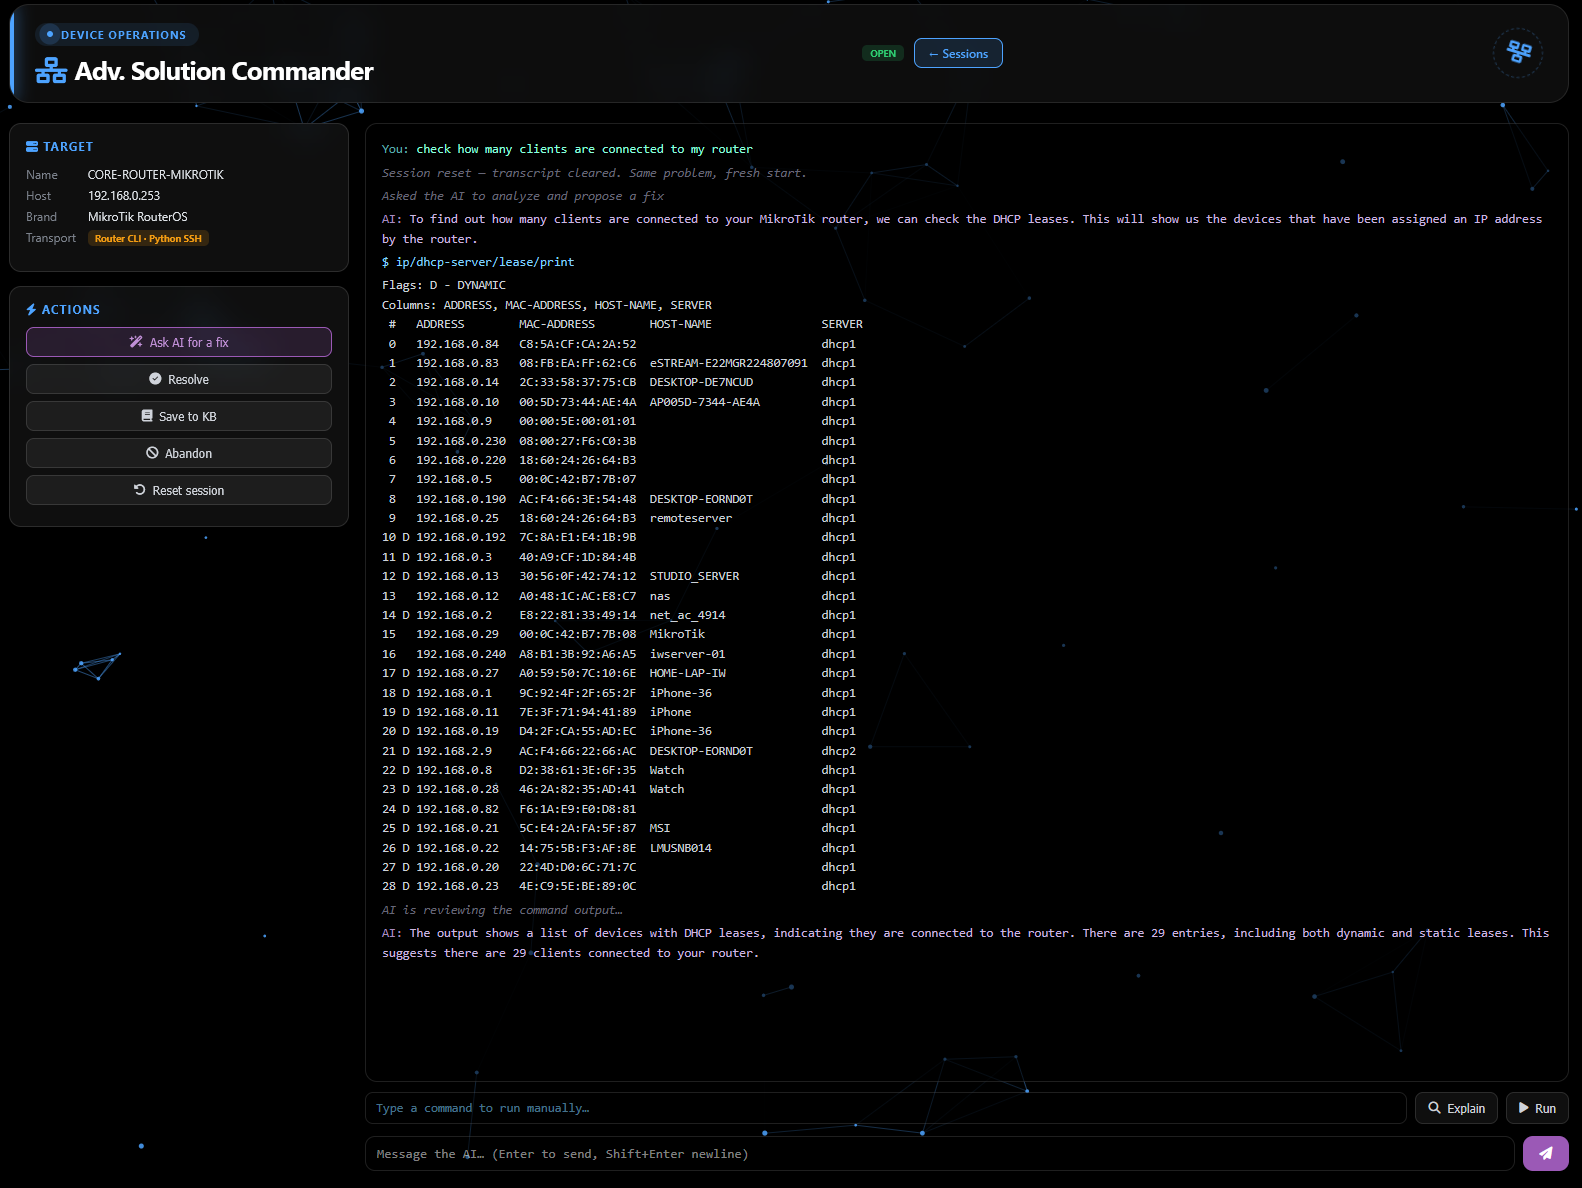
AI-over-SSH troubleshooting for routers and Linux. Describe the symptom and it investigates the live device, explains its reasoning first (a safe dry-run), guards destructive commands, and only executes when you approve. A senior network engineer's brain, on call, right inside your portal.
✦ Signature capability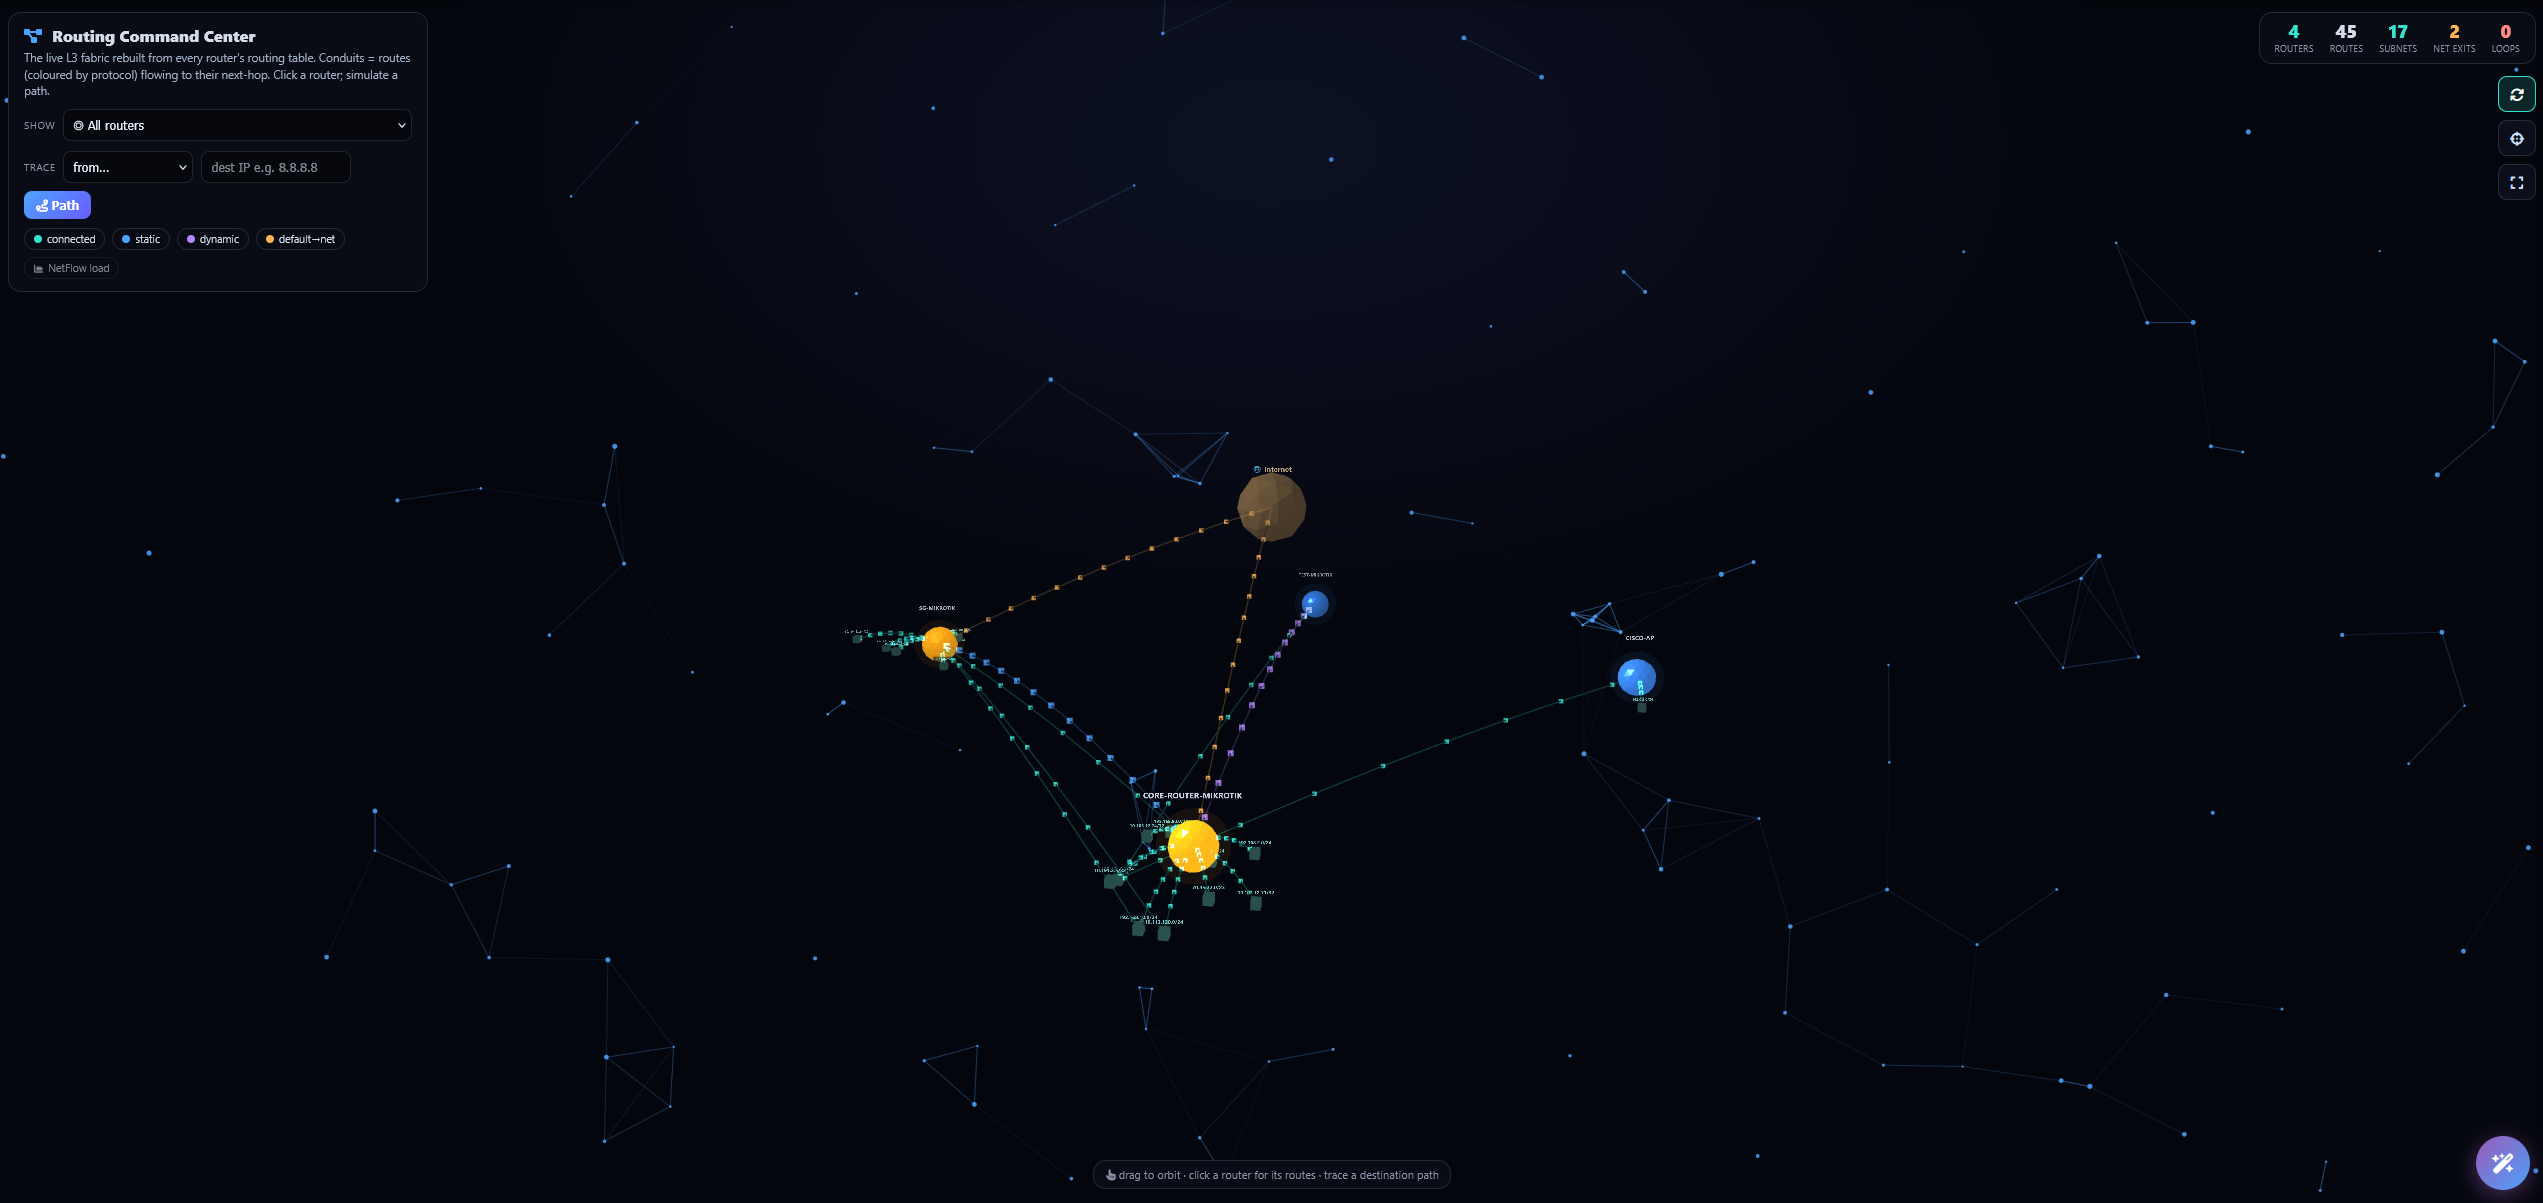
Your Layer-3 forwarding fabric, rebuilt live from the routers' own routing tables and rendered in 3D. Simulate any path before you change it, catch routing loops before they bite, overlay NetFlow, and get told the moment a route drifts from what you expect.
✦ Signature capability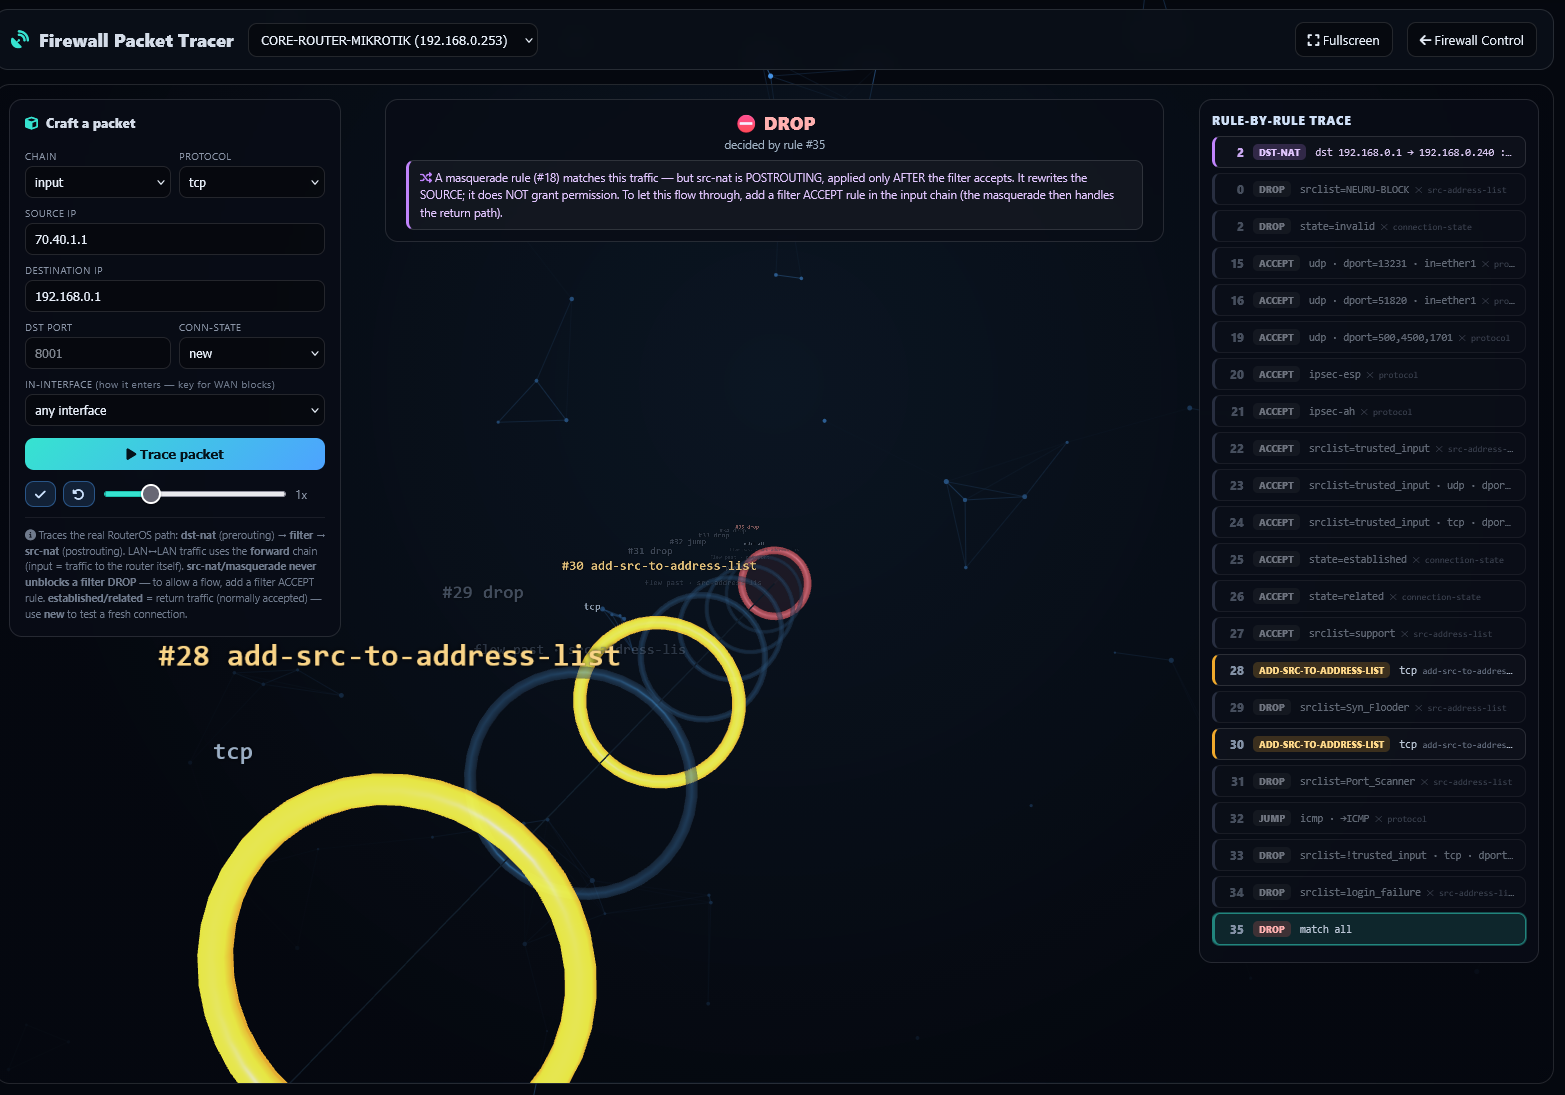
A visual MikroTik firewall editor with a what-if simulator and anti-lockout Safe-Apply: every change is commit-confirmed and auto-rolls-back if you lose access — so a bad rule can never lock you out of your own router. Test the change, then apply it with a safety net.
✦ Signature capability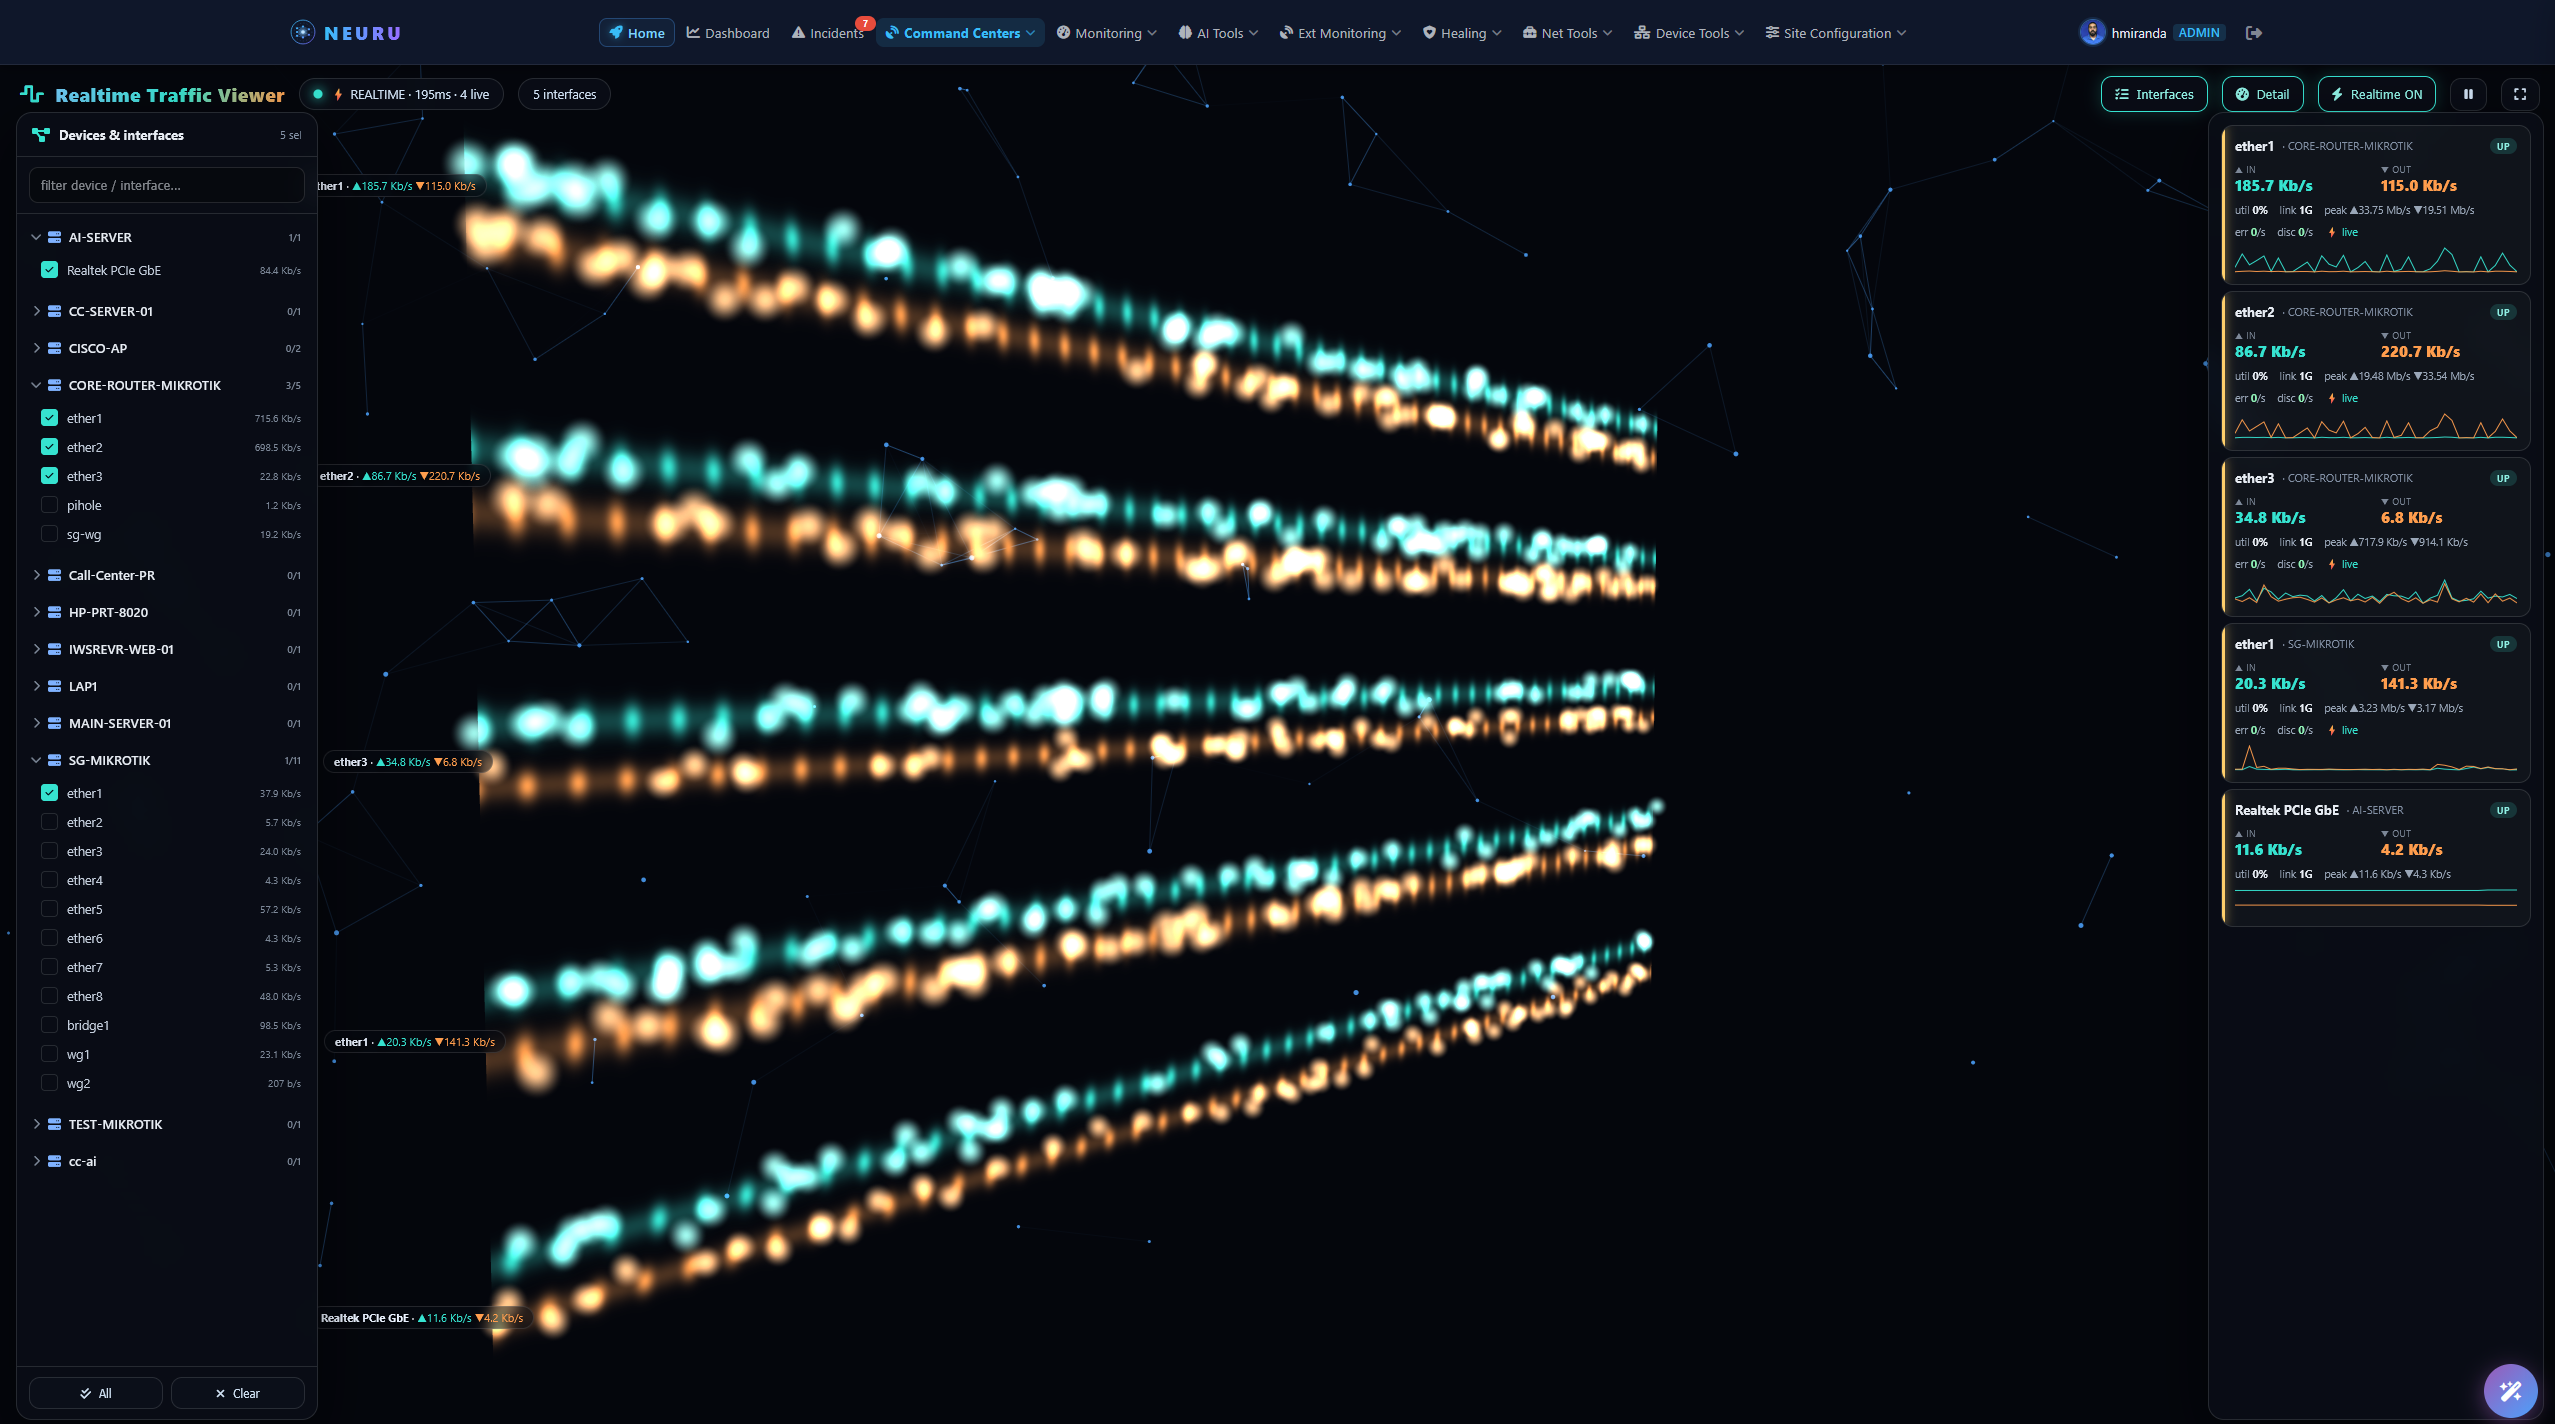
See your network breathe — in real time. Pick any device and interfaces (or all of them) and watch inbound and outbound traffic as animated beams: thin and calm when quiet, thick, fast and luminous when busy, glowing hot as links saturate and dimming the instant one drops. Flip on Realtime and the light moves the moment traffic does — down to errors & discards. It's the difference between reading your network and watching it.
✦ Signature capabilityCommand Centers
Immersive, full-bleed cockpits that turn your whole network into something you can literally watch, fly through, and command.
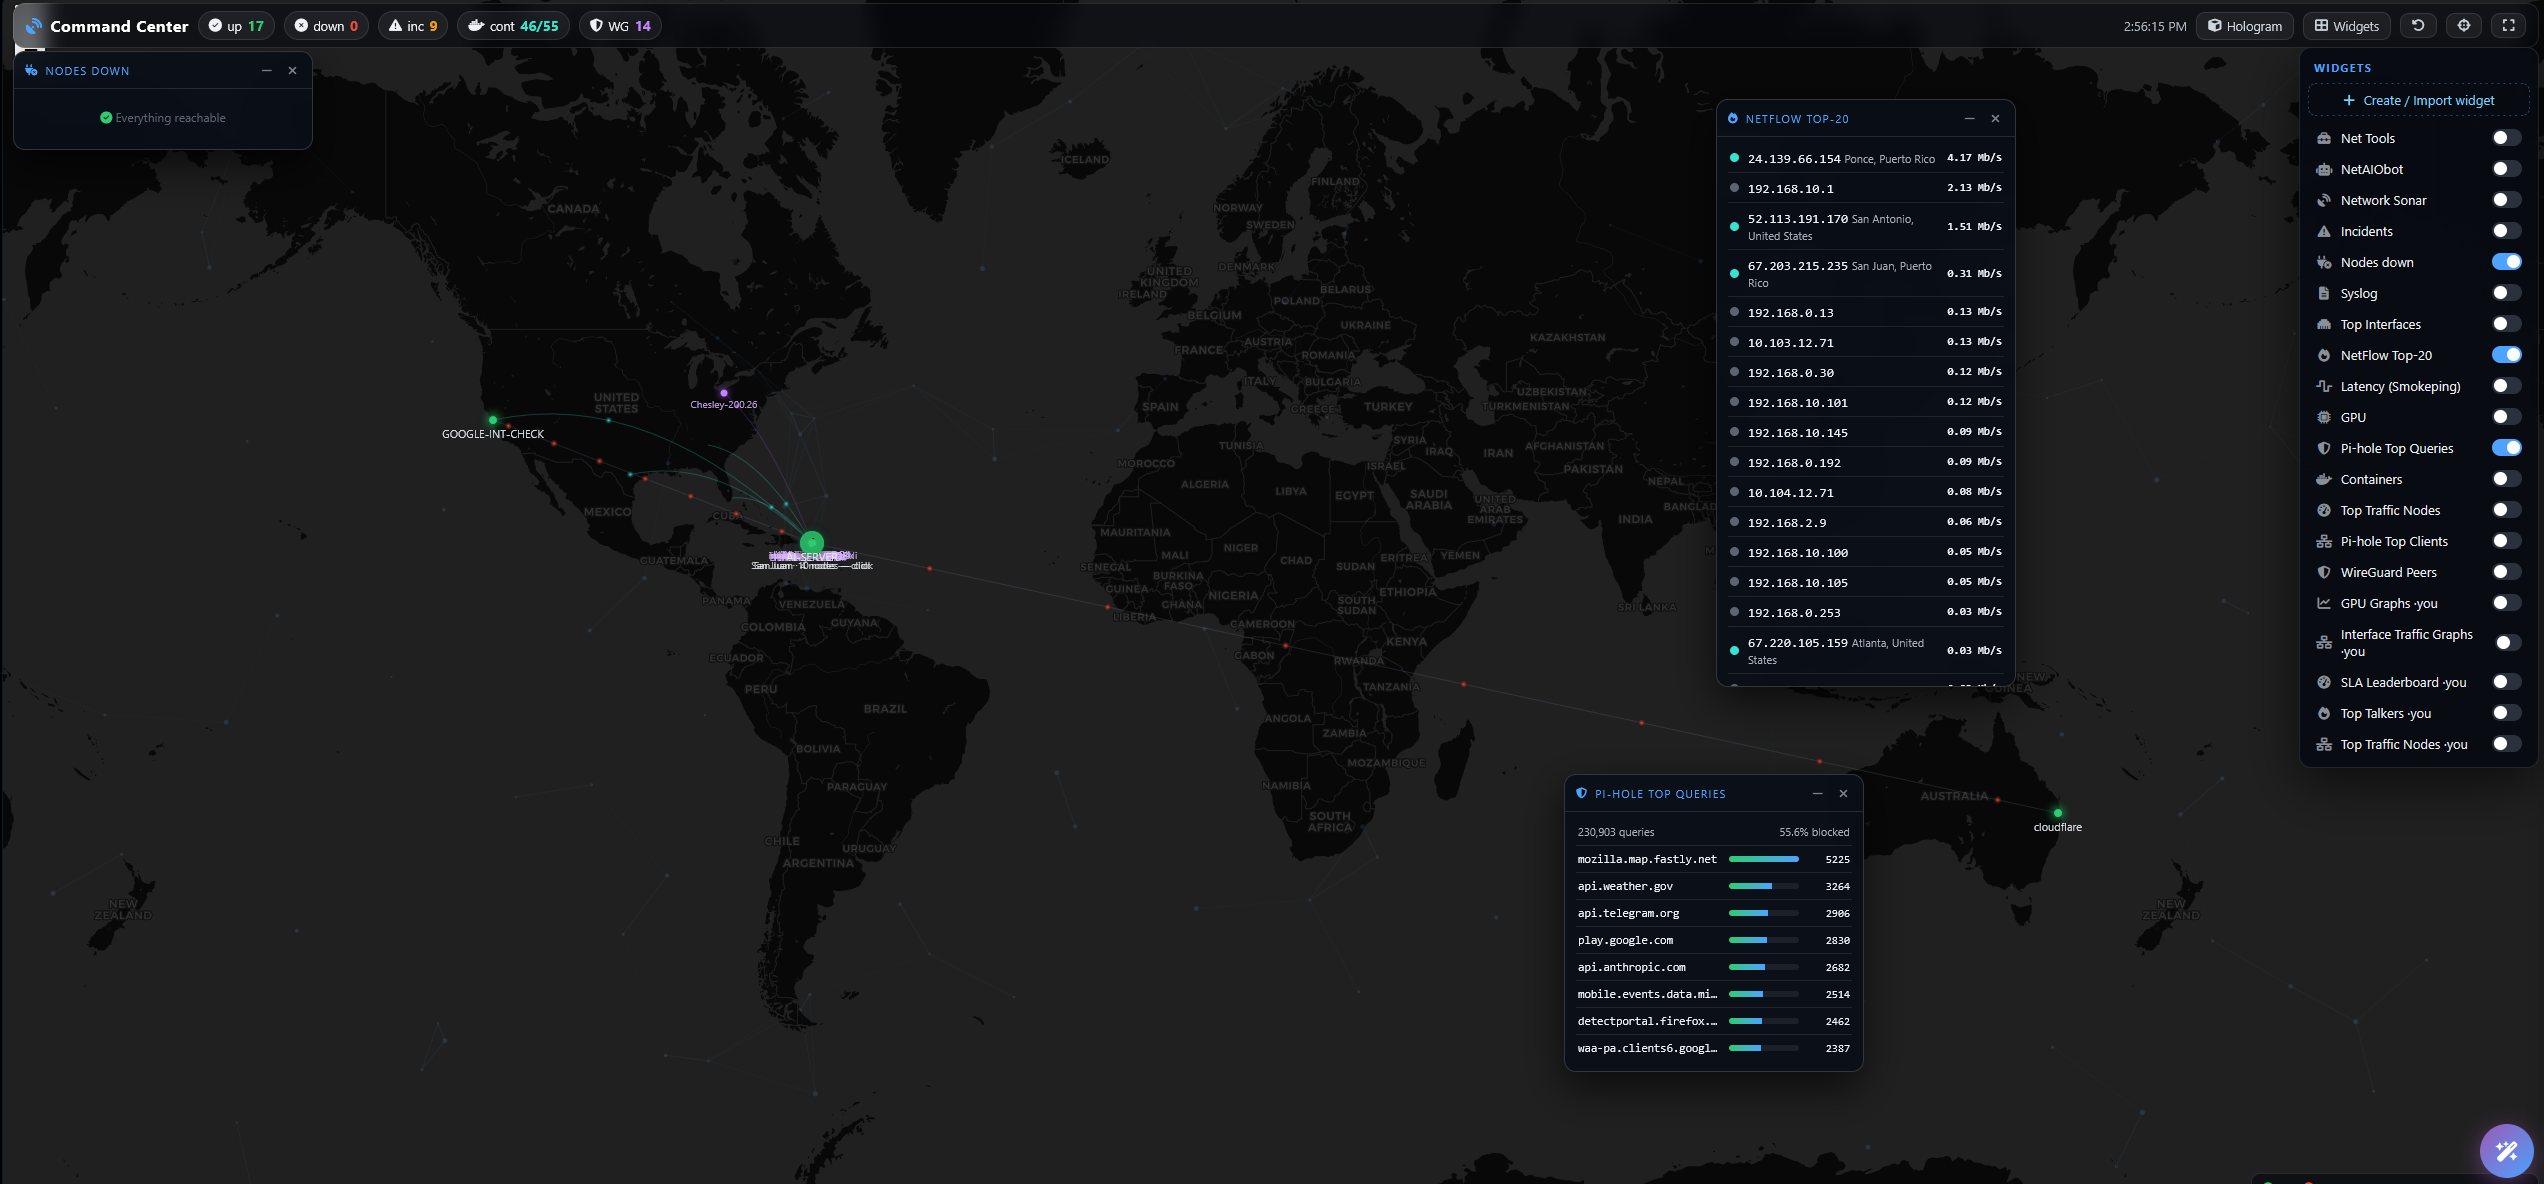
Command Center
A living map of your estate with draggable glass HUD widgets, click-a-node troubleshooting, and fullscreen NOC mode — your personal mission control.
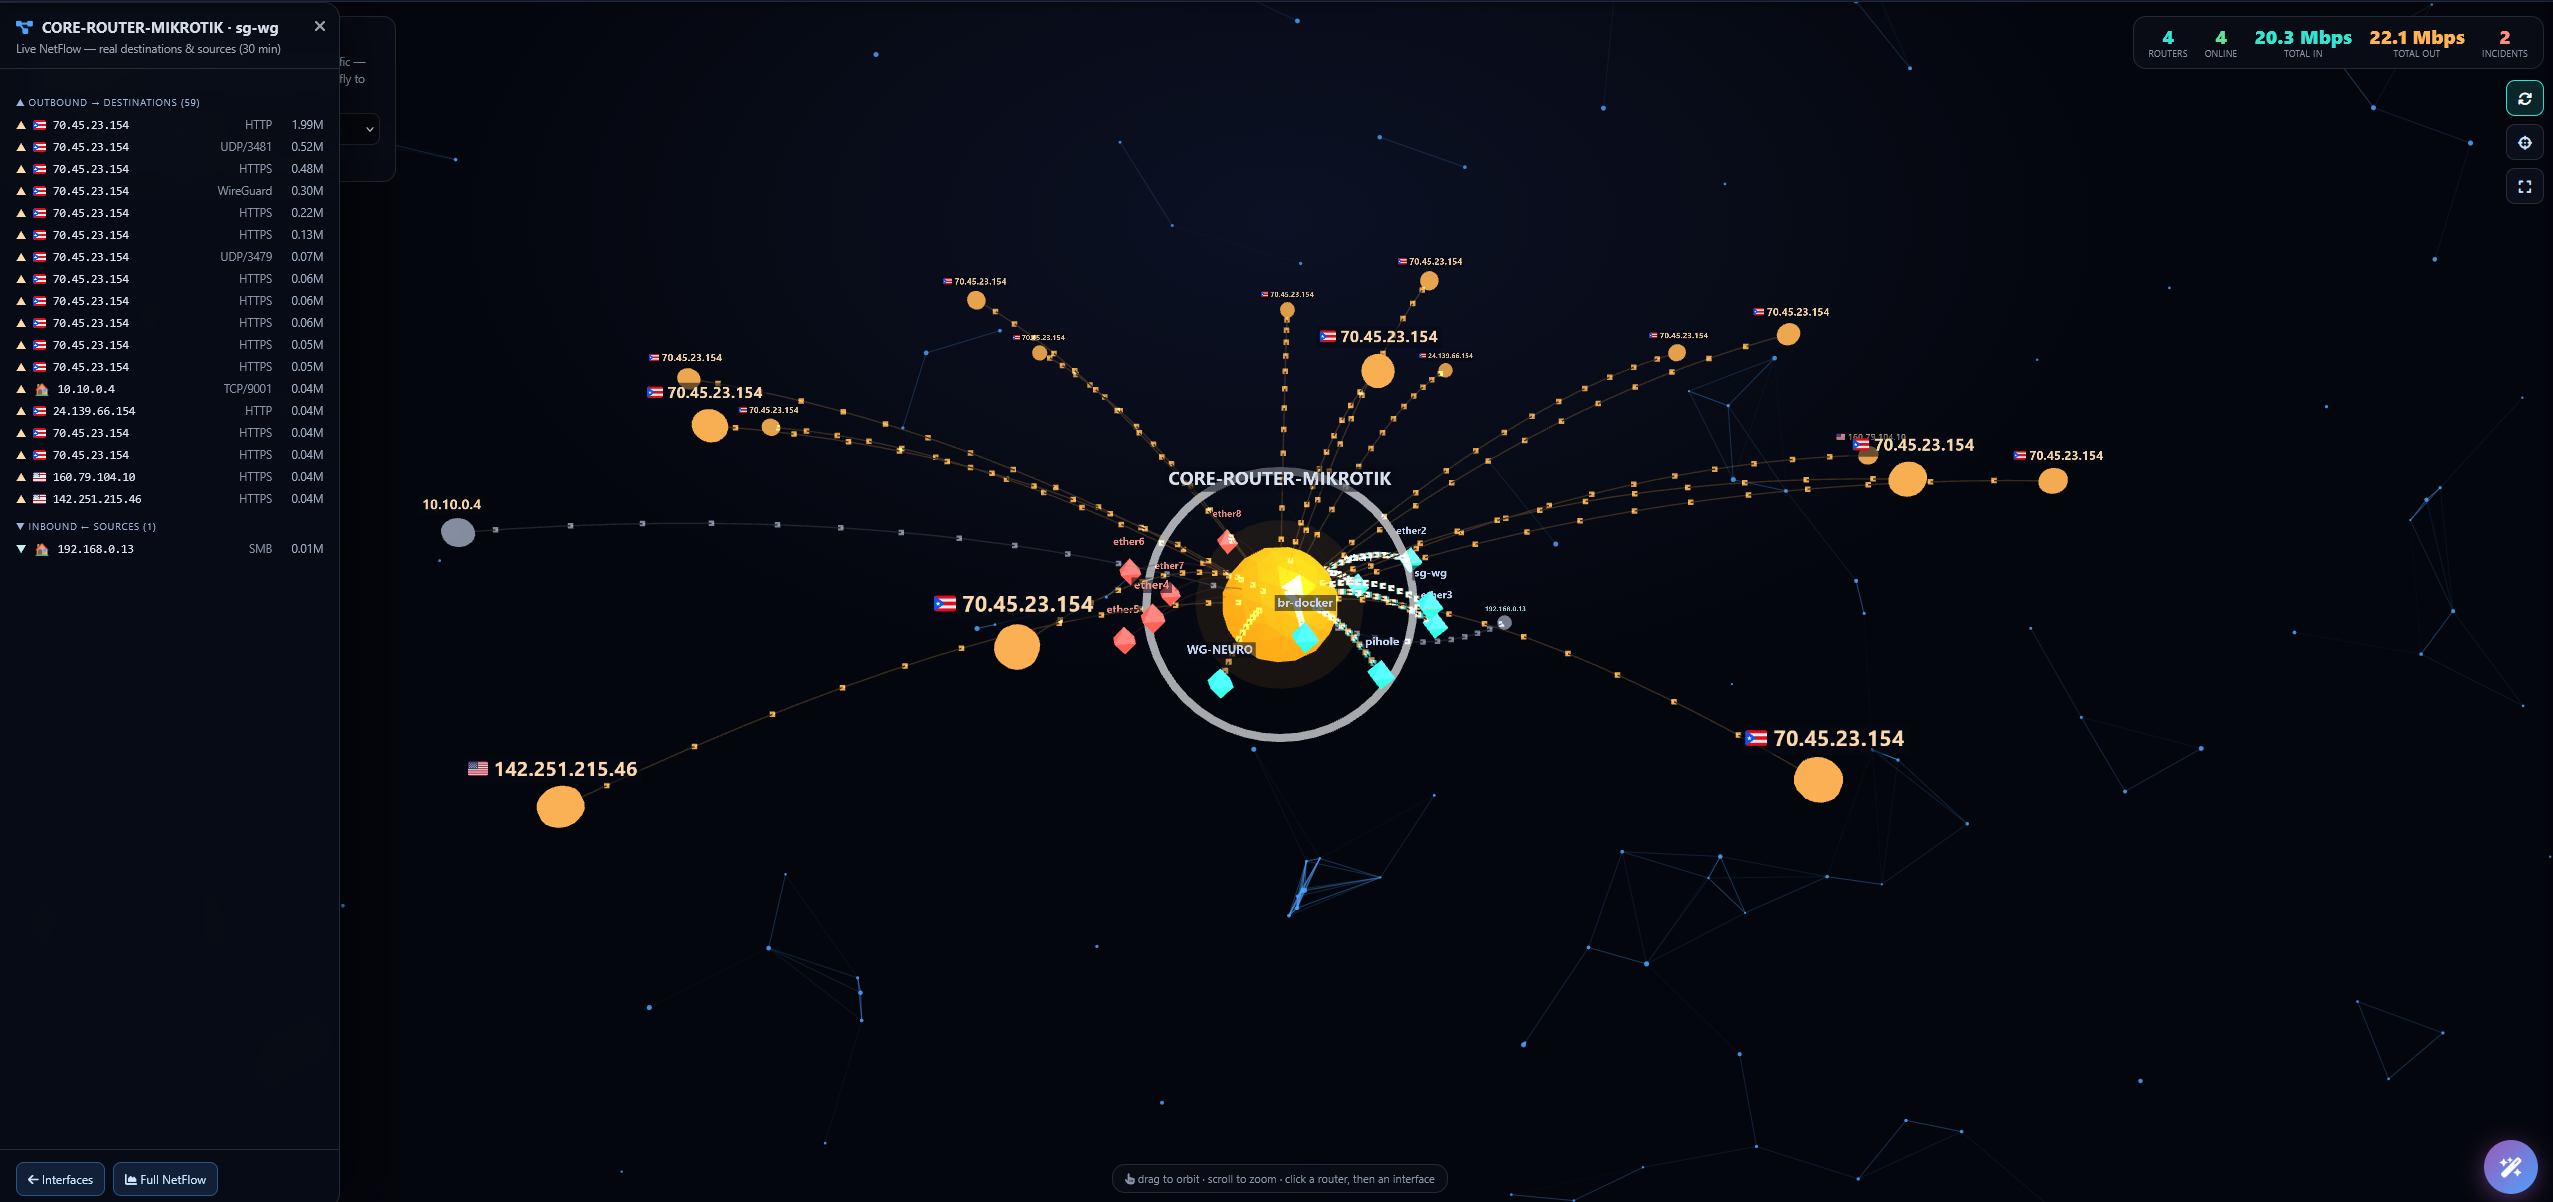
Router Command Center MikroTik deep-dive
Fly through a single router end-to-end — interfaces, peers, live SSH facts and health on one futuristic dashboard, DB-instant and live at once. Deep-dives your MikroTik over SSH.
Routing Command Center
A WebGL Layer-3 forwarding fabric rebuilt straight from your routers’ routing tables — simulate any path, catch loops, overlay NetFlow, and get alerted on route drift.
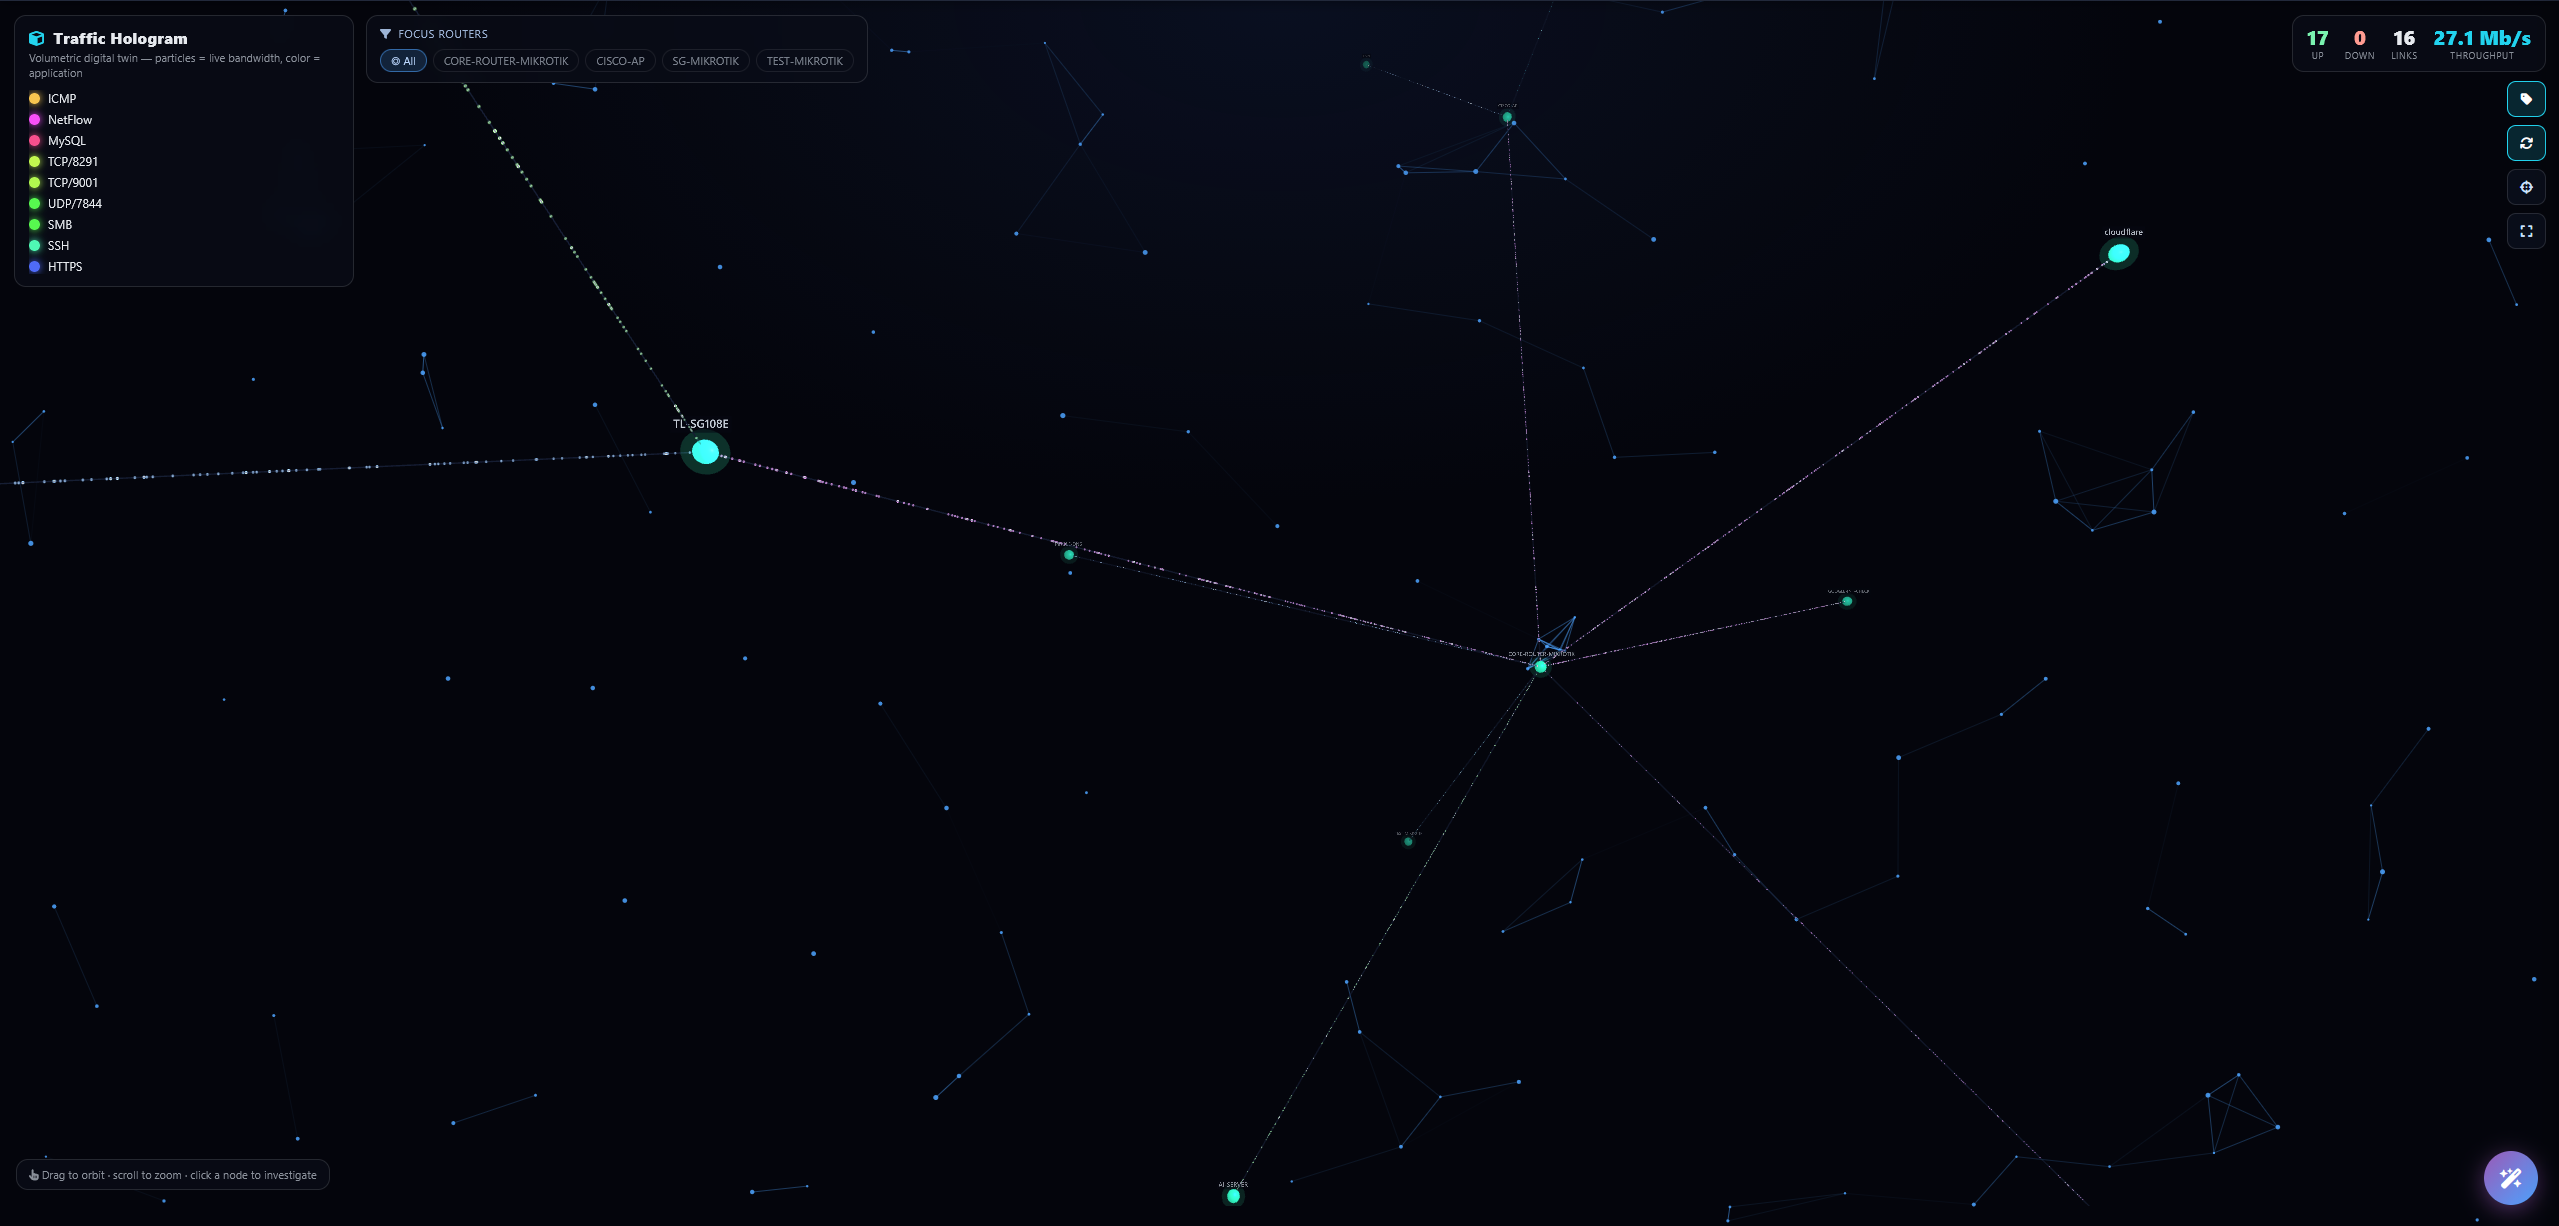
Traffic Hologram
Your infrastructure as a volumetric 3D hologram — GPU particle streams flow through virtual cables, thickening with throughput, colored by application. Grab it, spin it, read it at a glance.
Realtime Traffic Viewer
See your network breathe in real time. Every interface becomes a living laser of light — inbound & outbound beams that thicken, quicken and glow with real load, run hot as links saturate, and dim the instant one goes down. Flip on Realtime and the light moves the moment traffic does — down to errors & discards. Not a chart that refreshes; your network, alive.
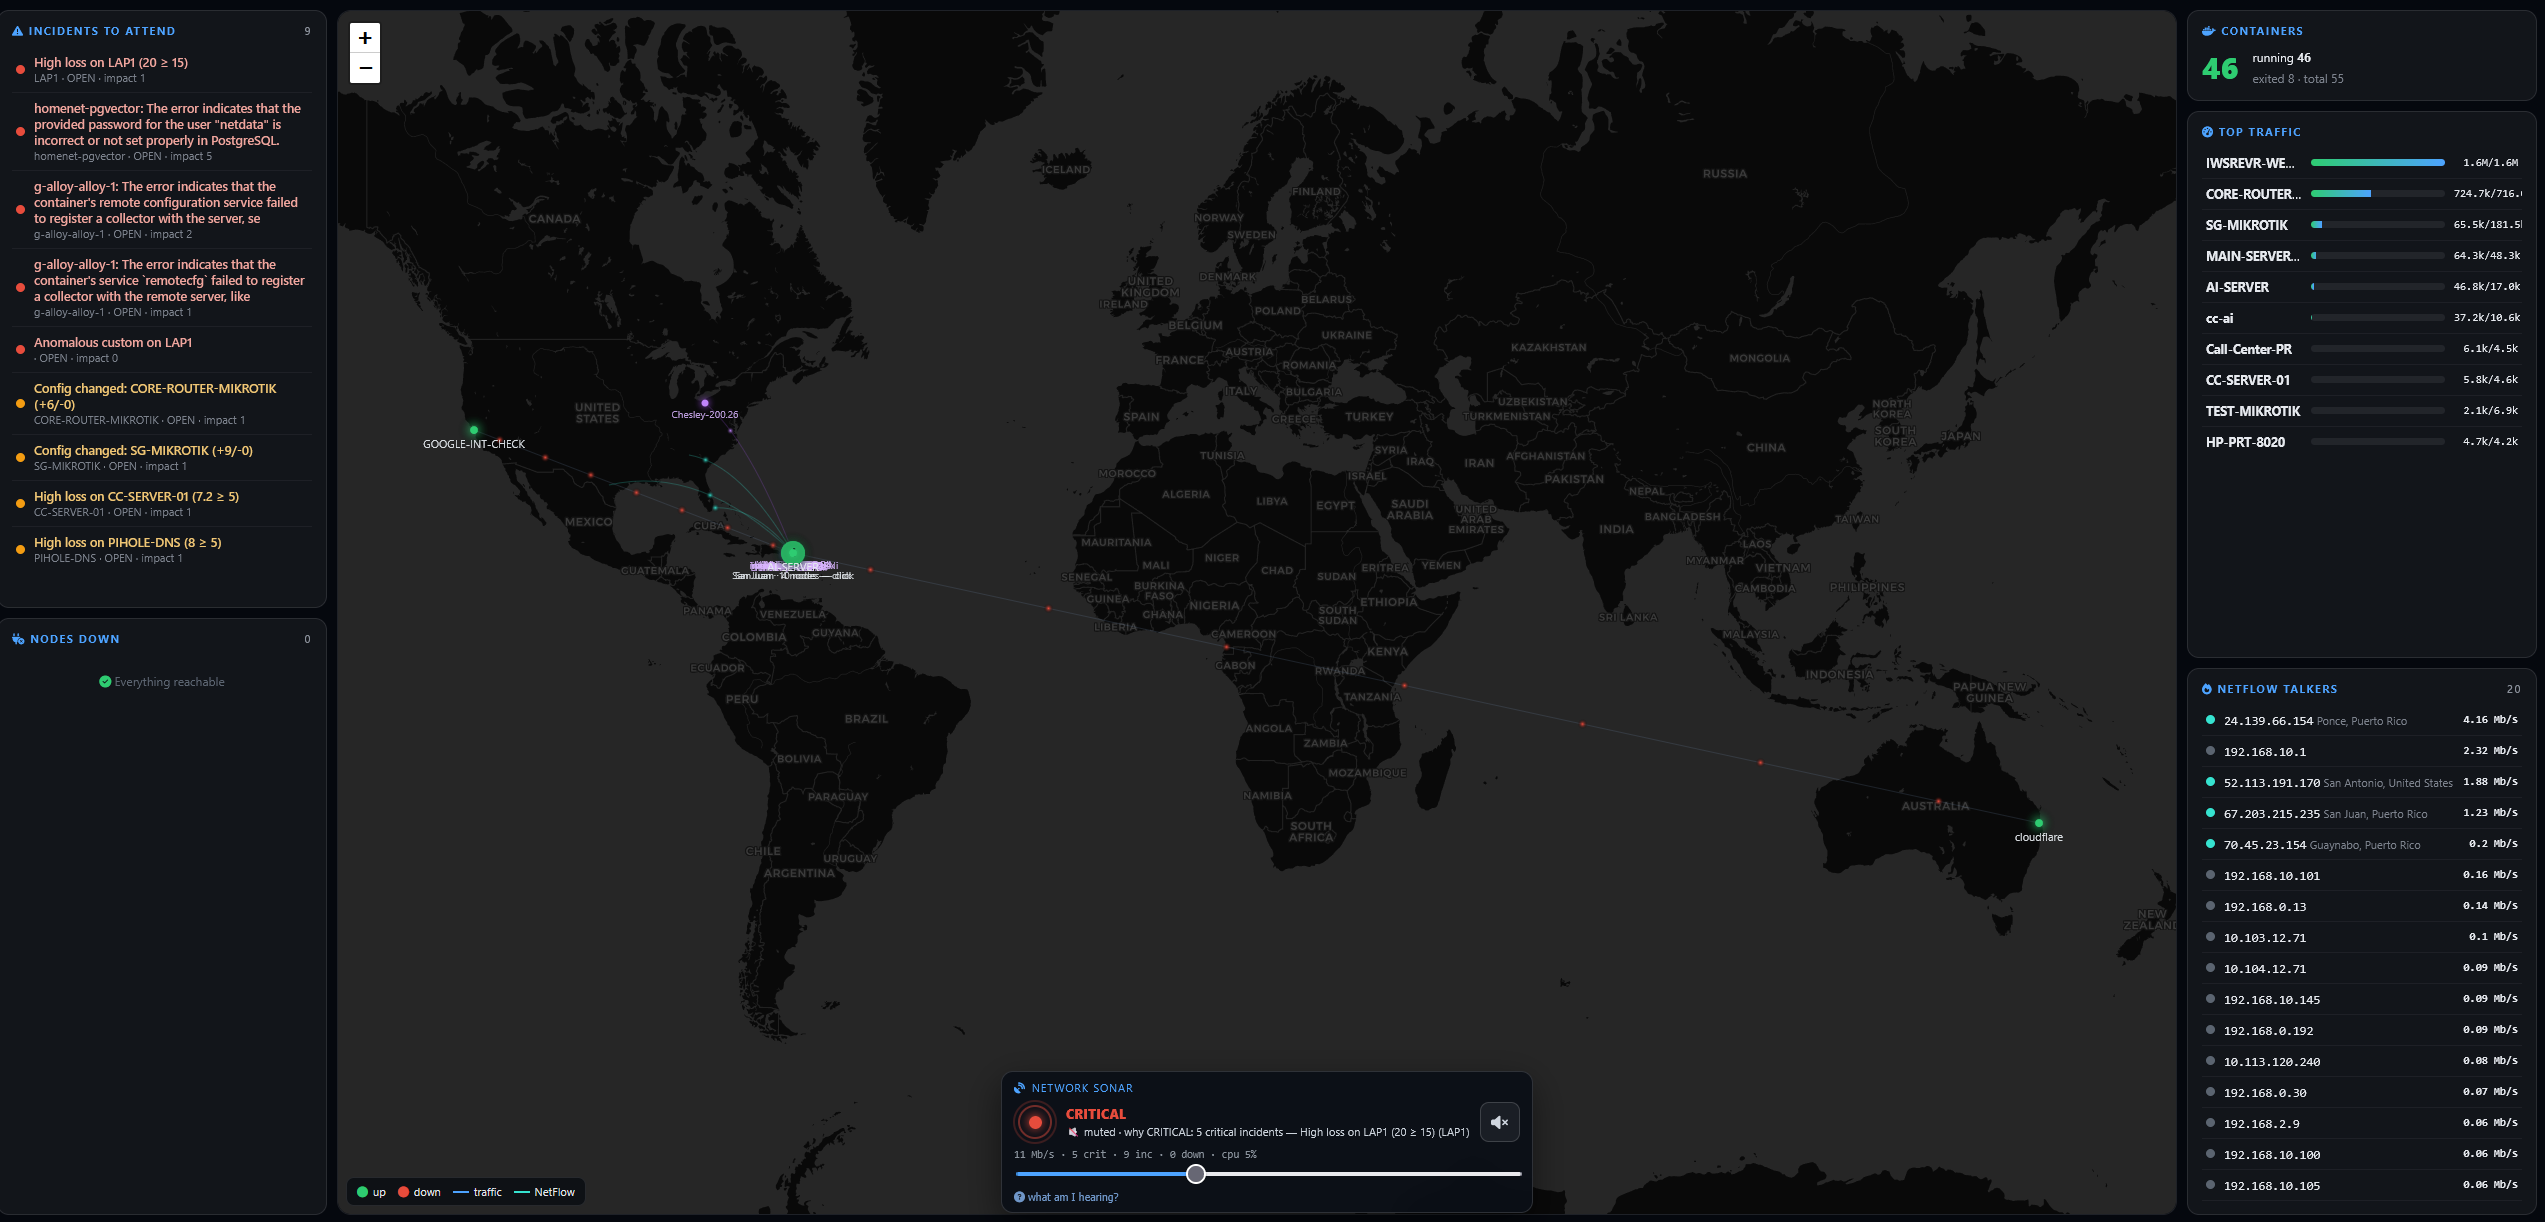
Geo Wall
A world-map video wall: every site glowing on the globe with animated traffic comets flying between them. Built for the big screen in the room.
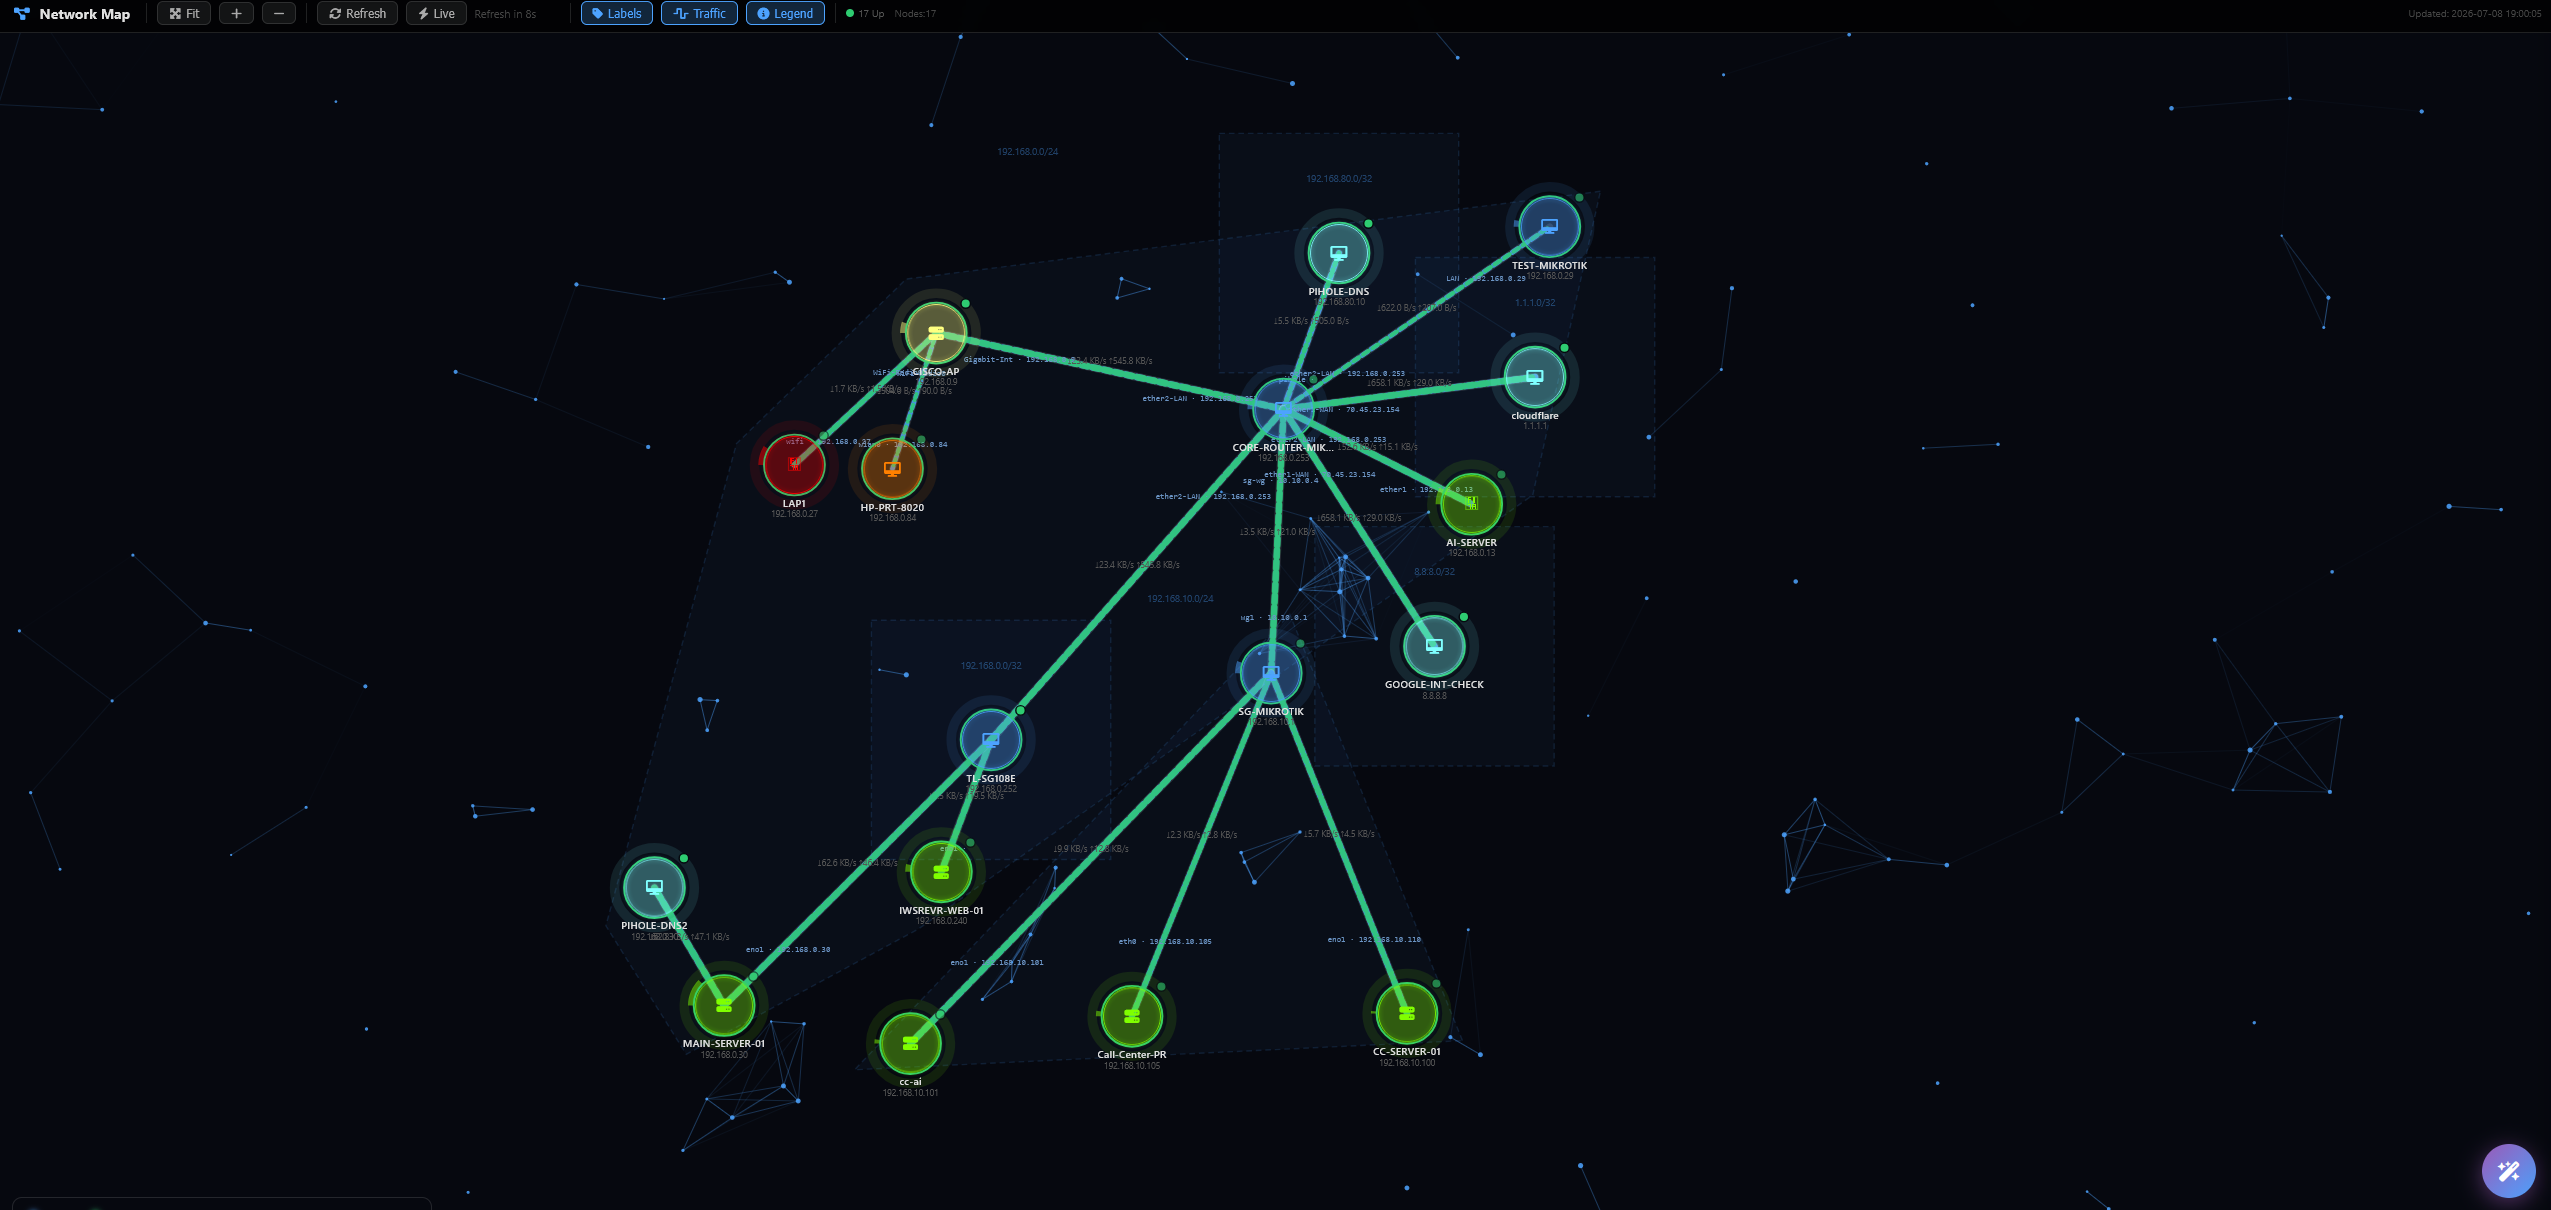
Live Topology Map
An auto-drawn, always-current map of how everything connects — links light up with real traffic and health.
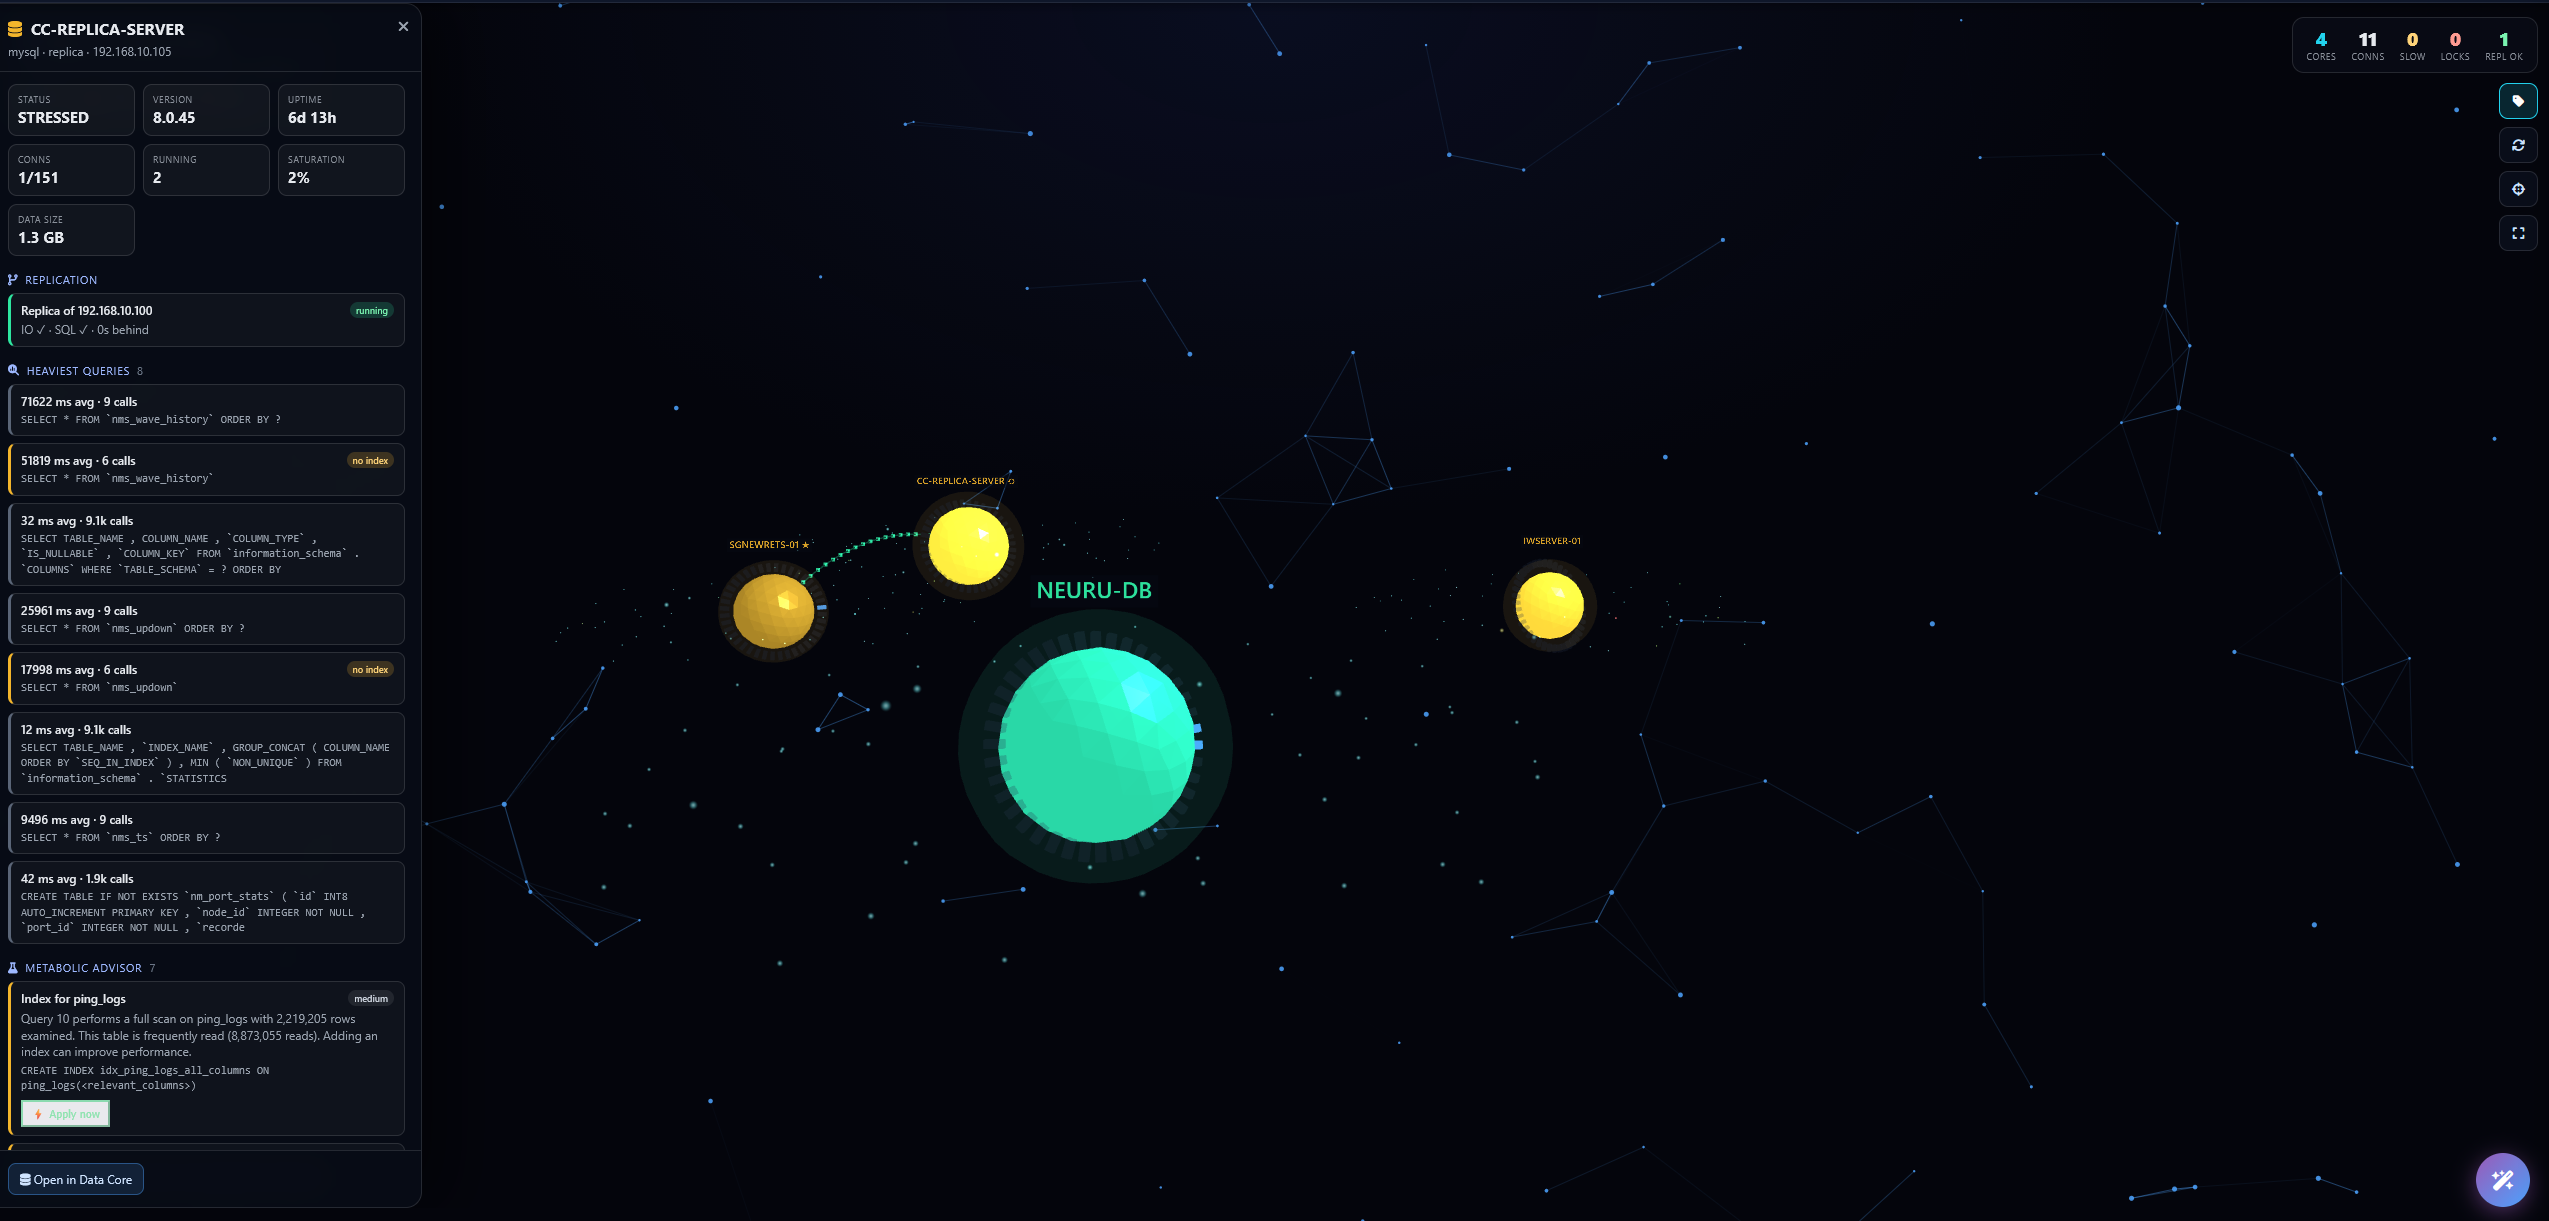
DB Observatory
Every database as a pulsing 3D reactor — the core beats with query threads, rings show the connection pool, a galaxy maps table heat.
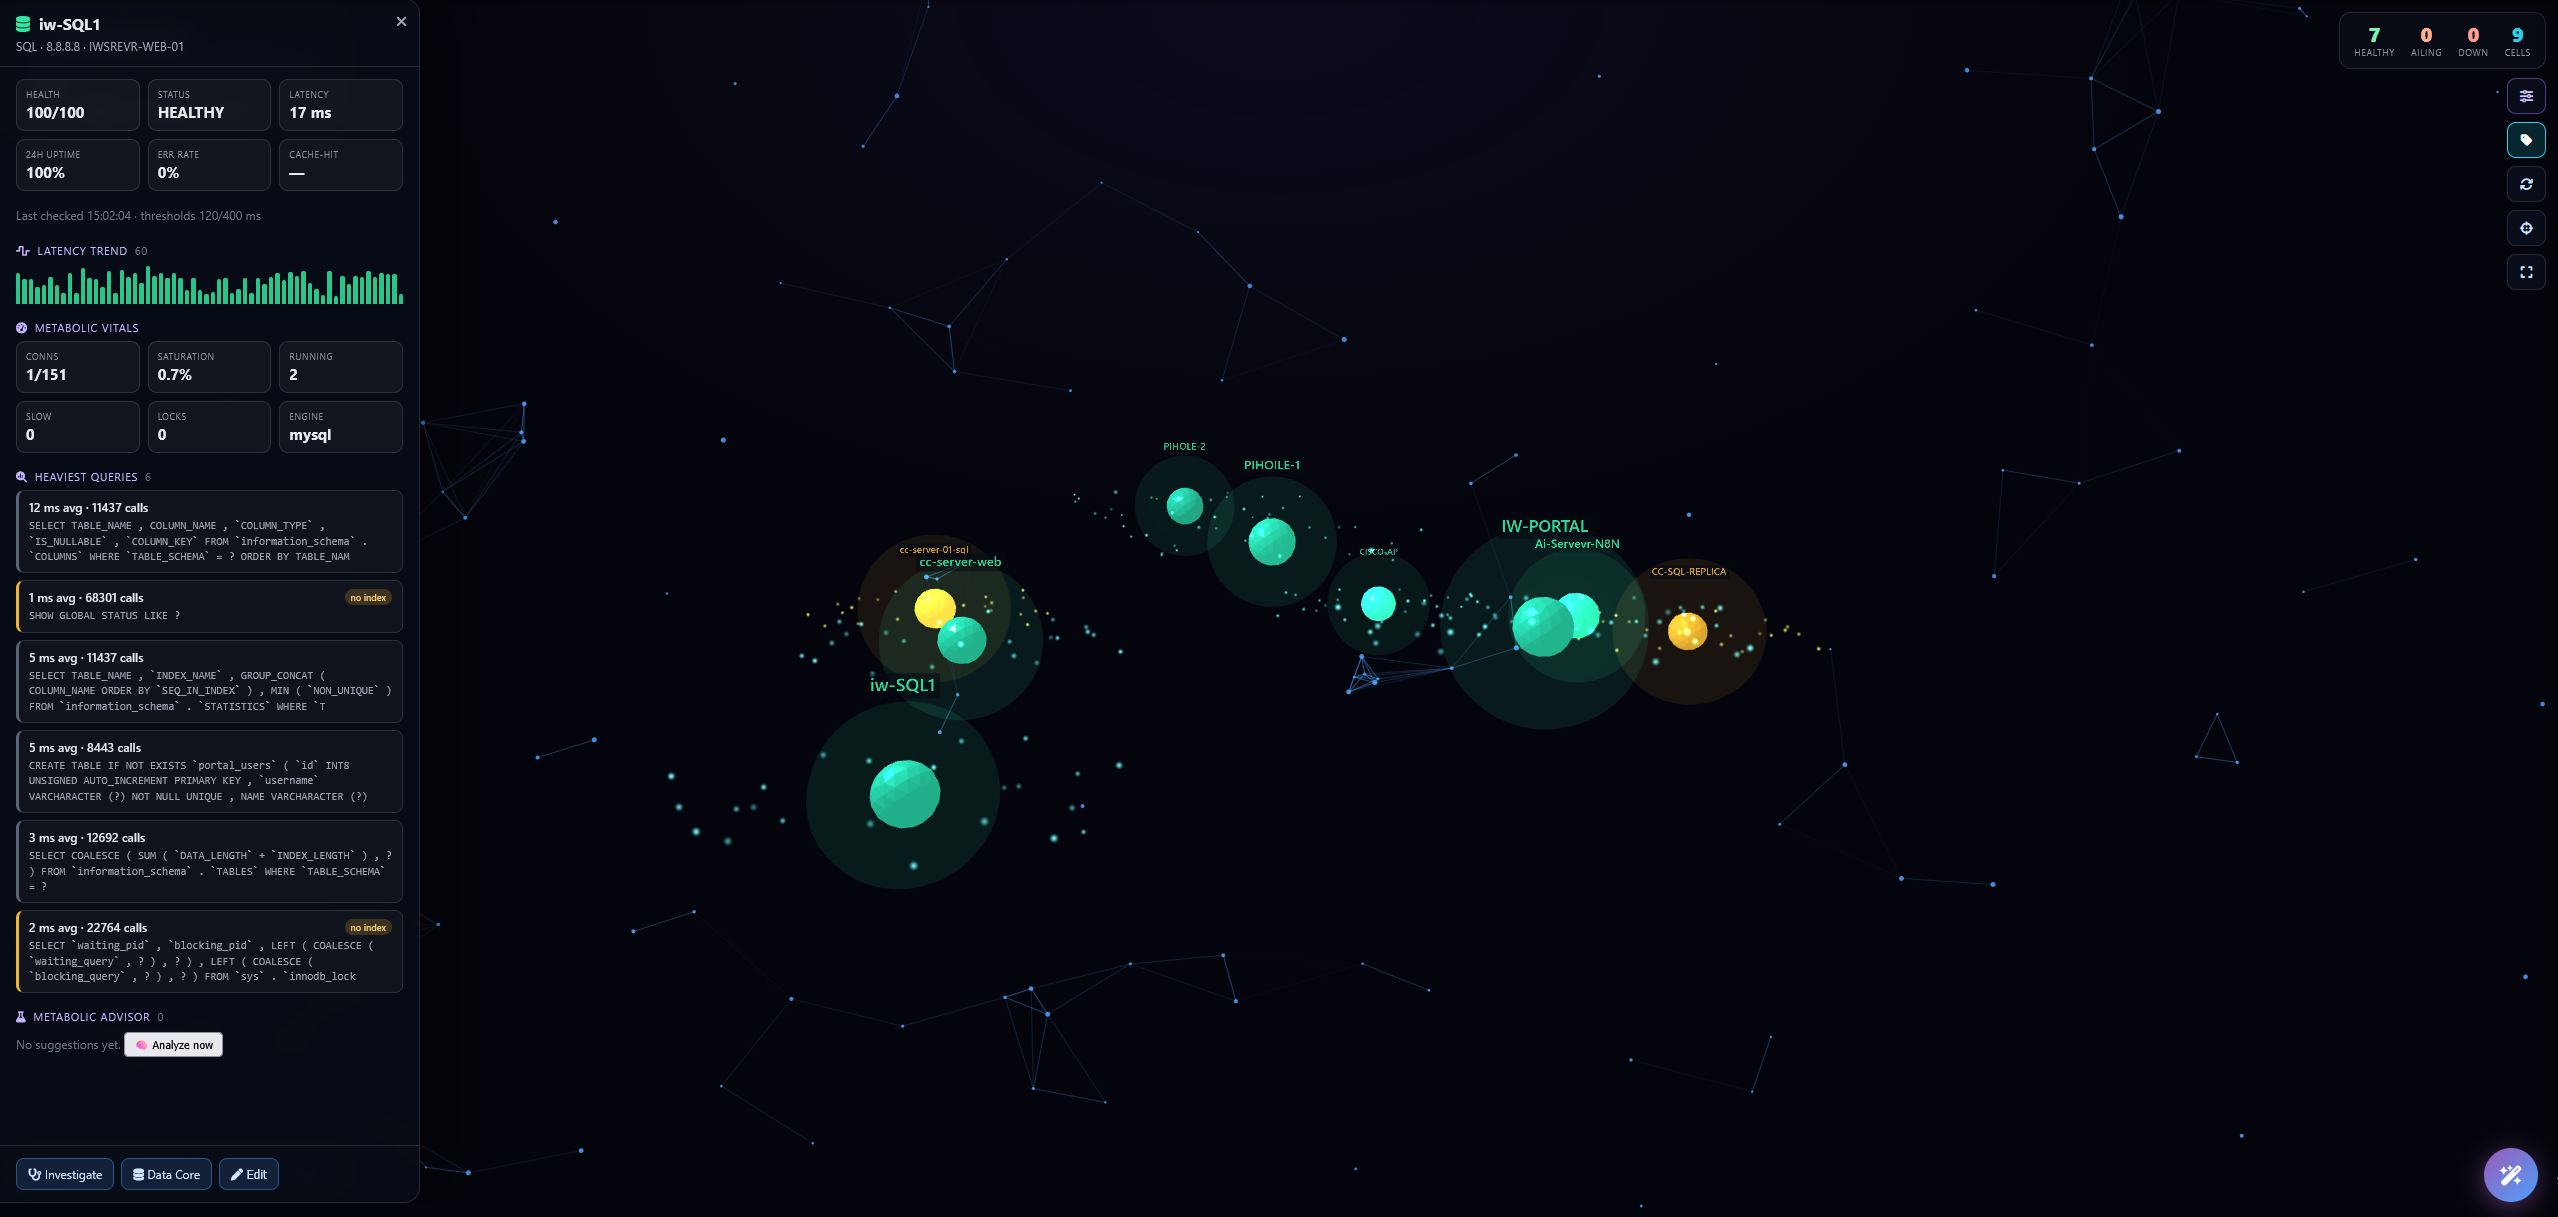
Service Biosphere
Your services rendered as living cells that breathe, glow, and visibly sicken the moment their real vitals degrade.
See everything
From a single interface to your entire estate — real-time, historical, and predictive. If it moves on your network, NEURU sees it.
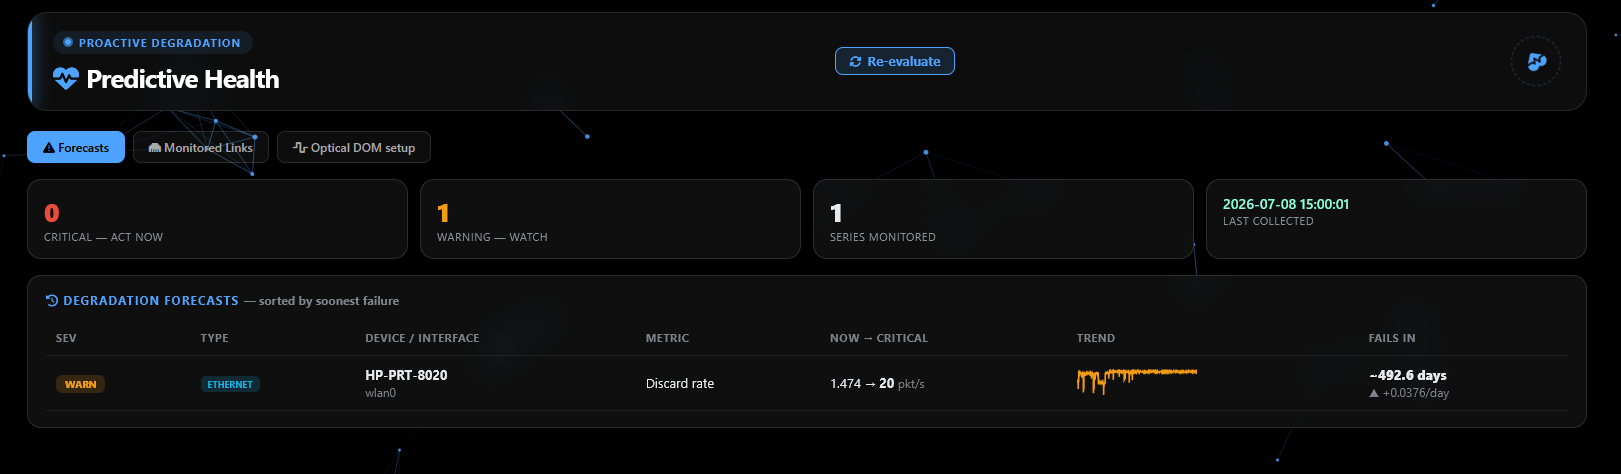
Predictive Health
Forecasts failure before it happens — “this link dies in N days” from optical & error-rate trends, so you fix it on a Tuesday, not at 3 a.m.
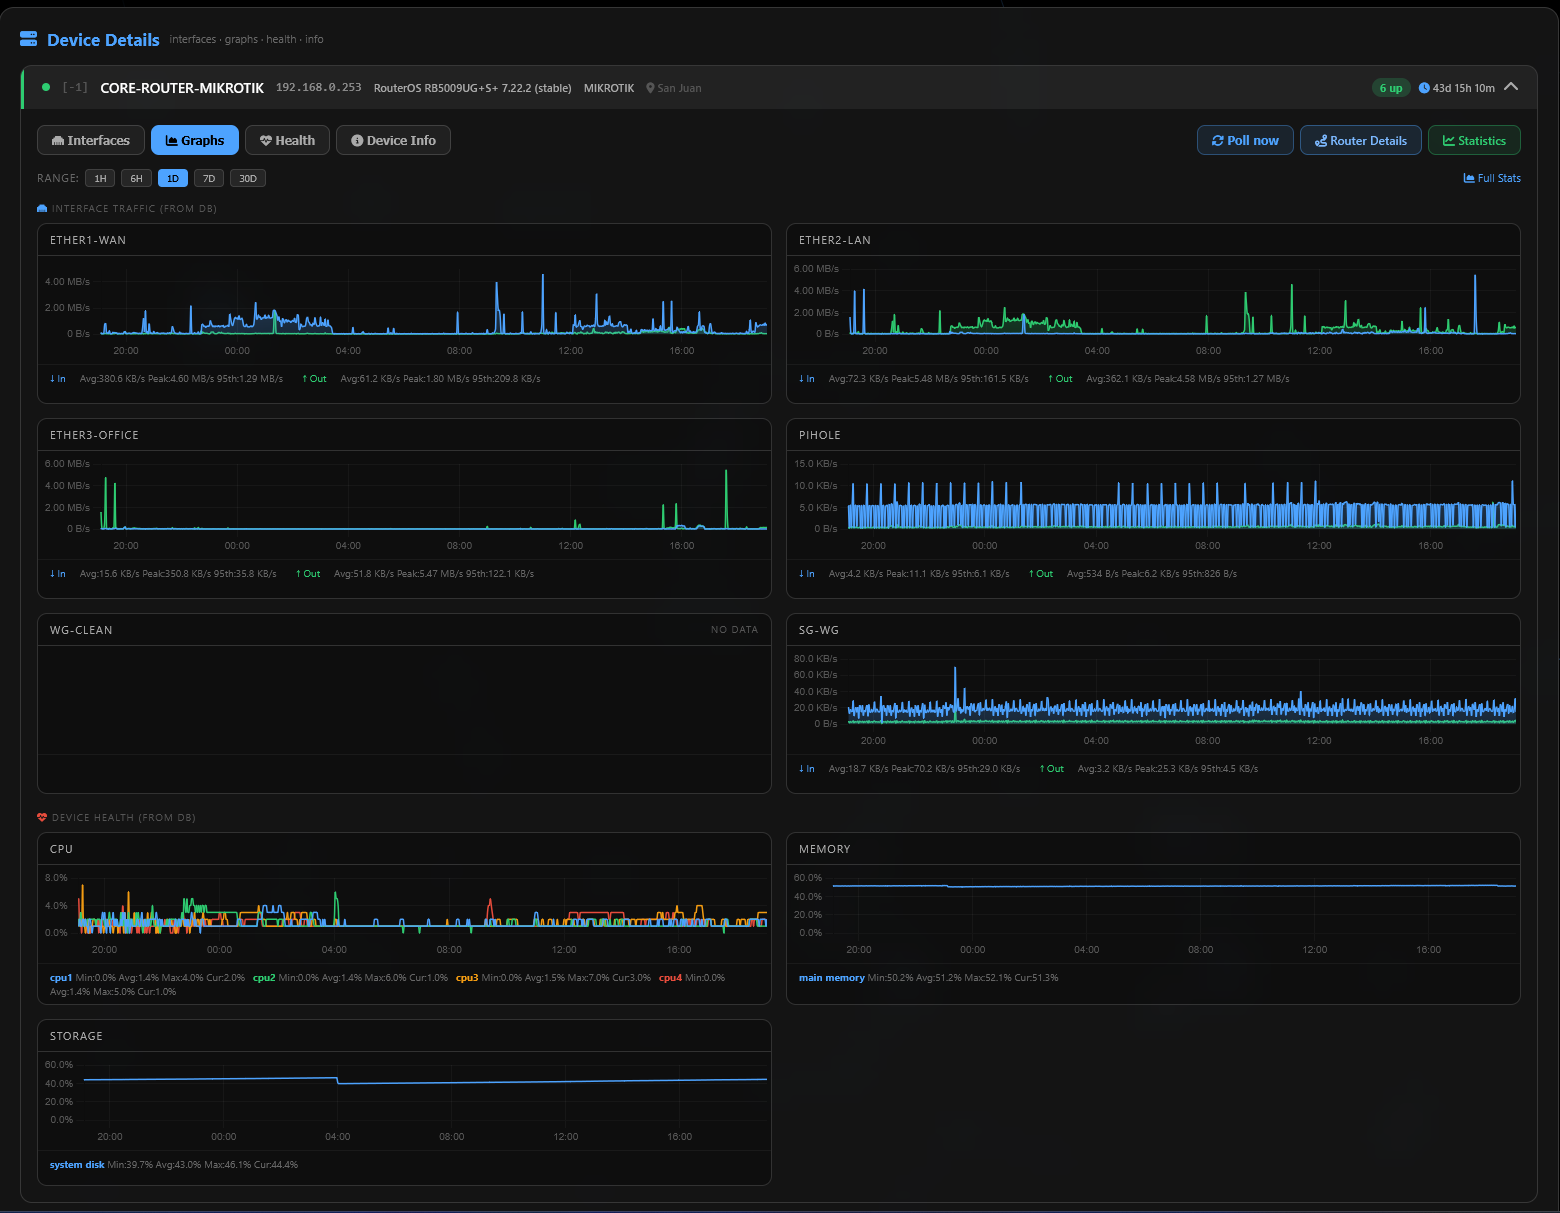
Live Dashboard
Counters, per-node traffic and health that update in place every few seconds — no refresh, just a network that breathes.
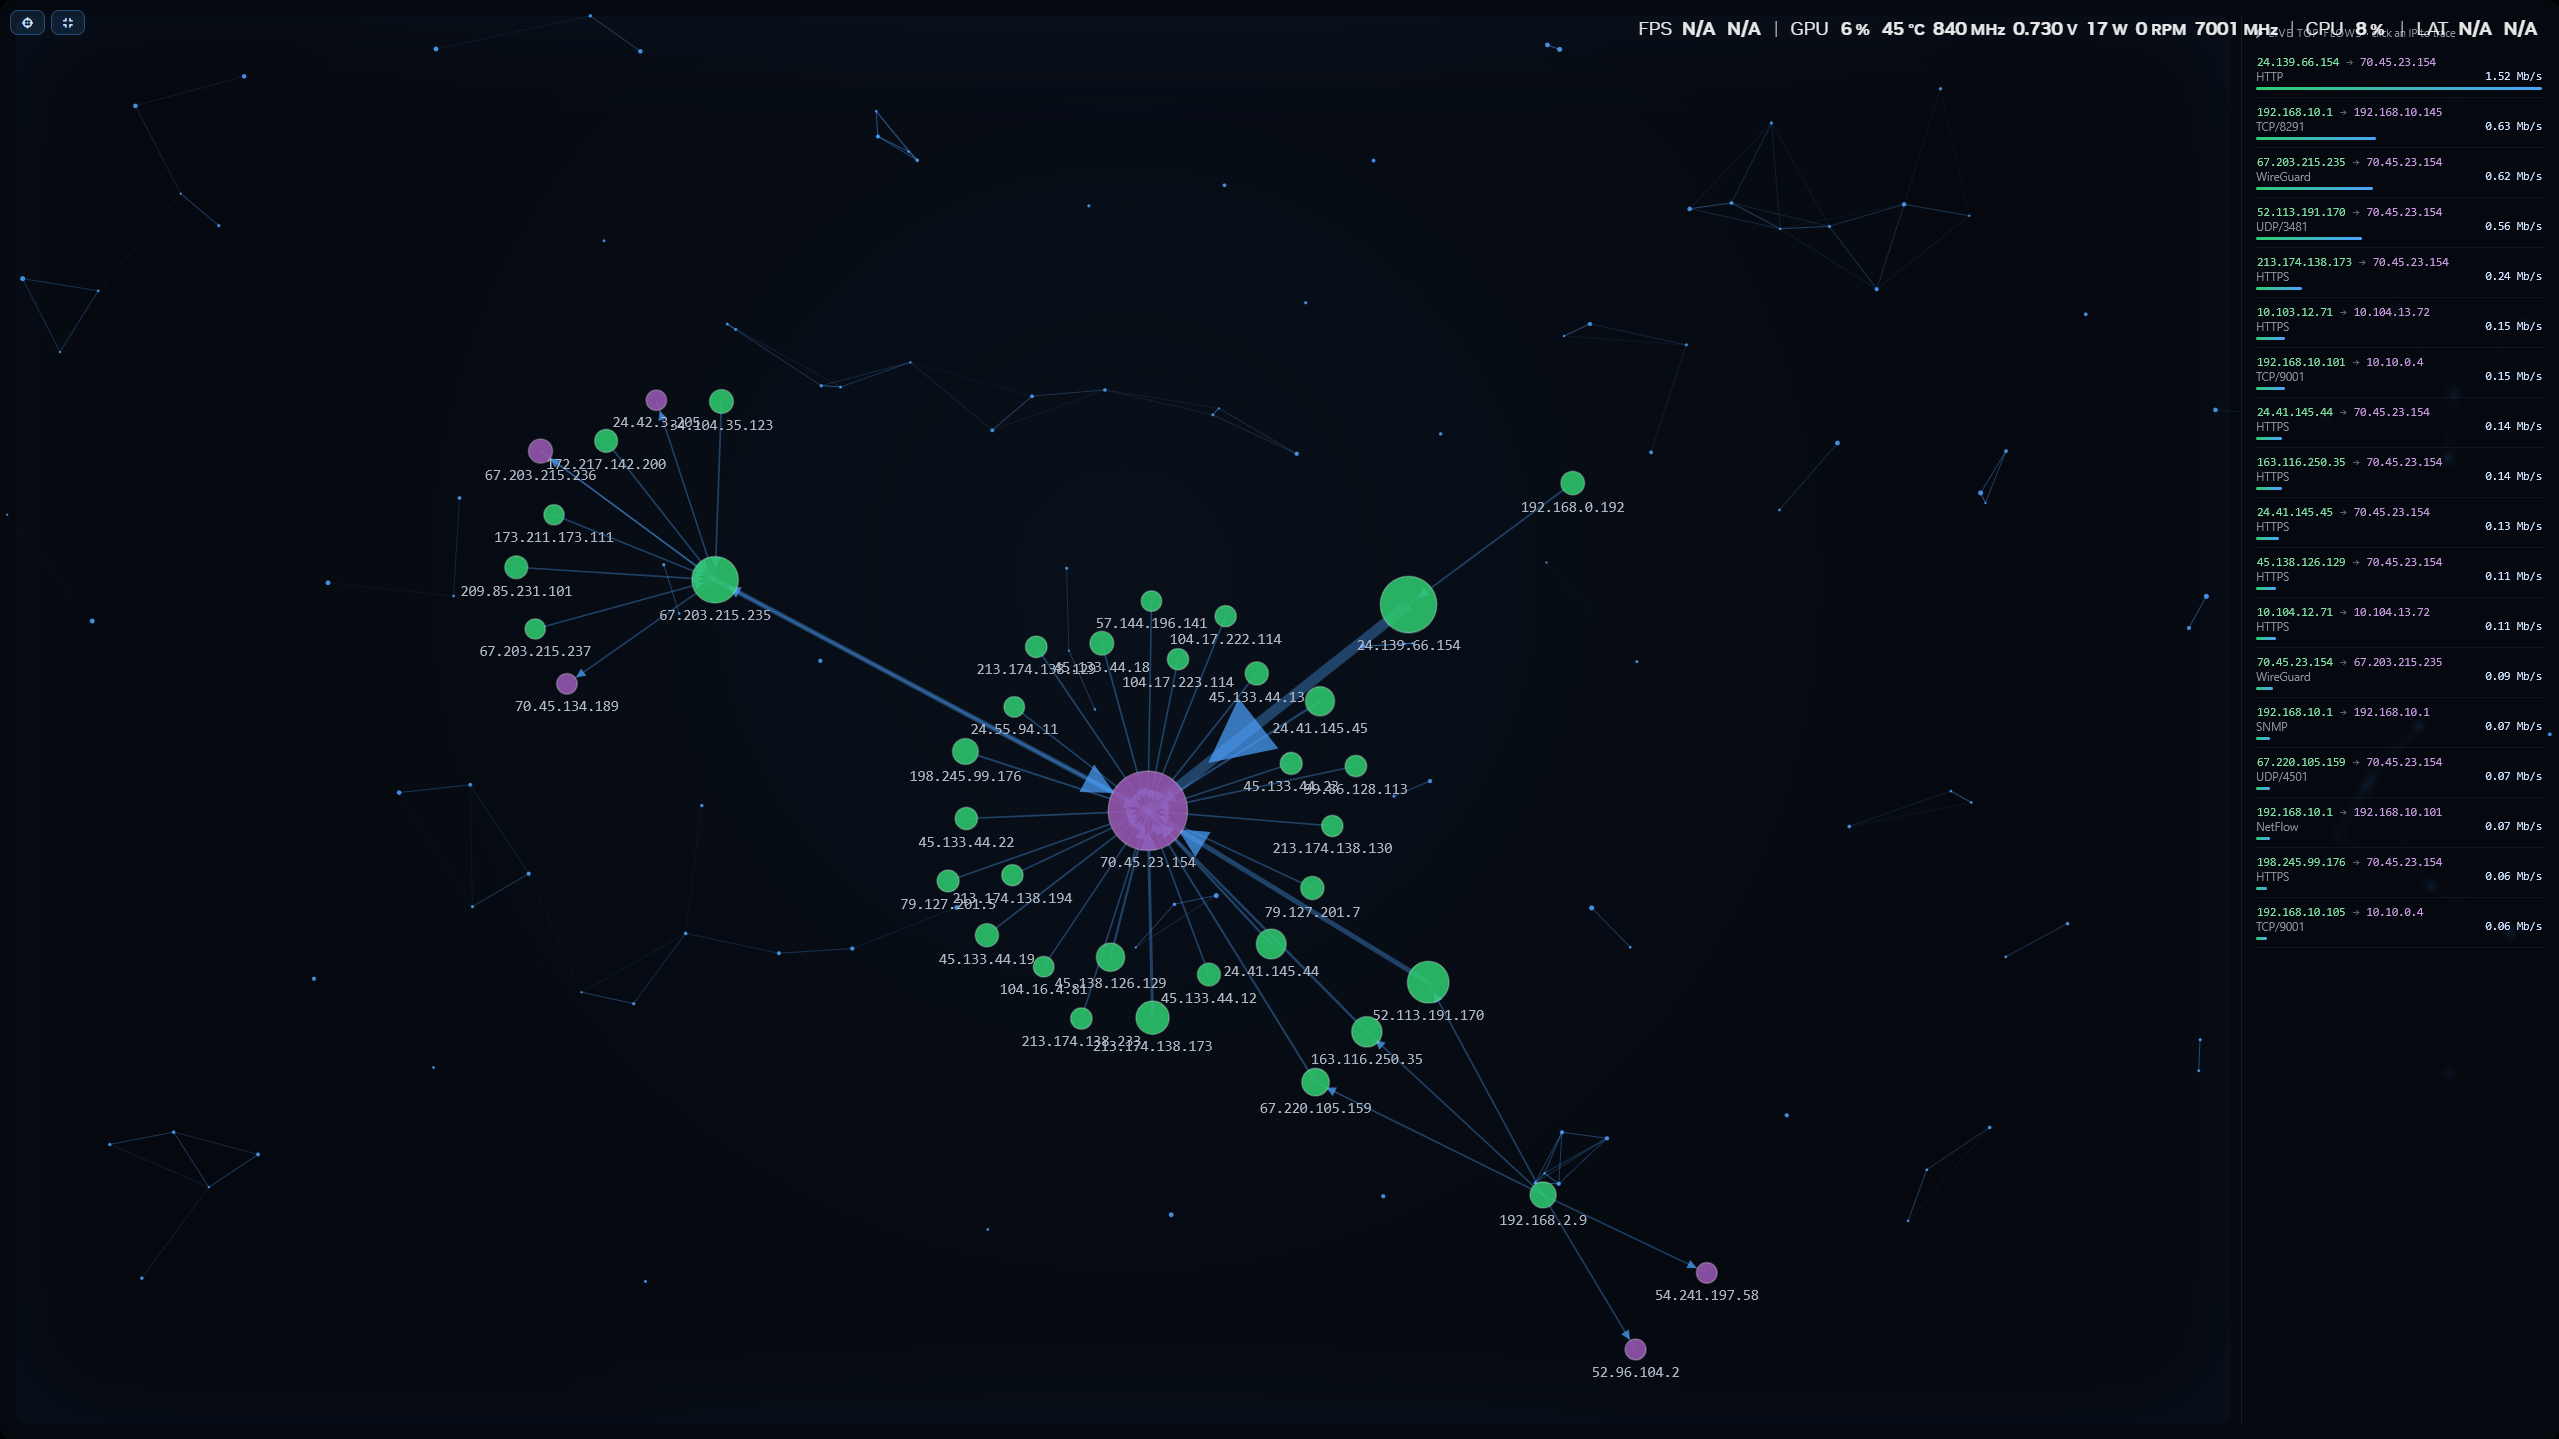
NetFlow Analyzer
See bandwidth by application, talker and conversation — know exactly who and what is eating your pipe, with spike alerts.
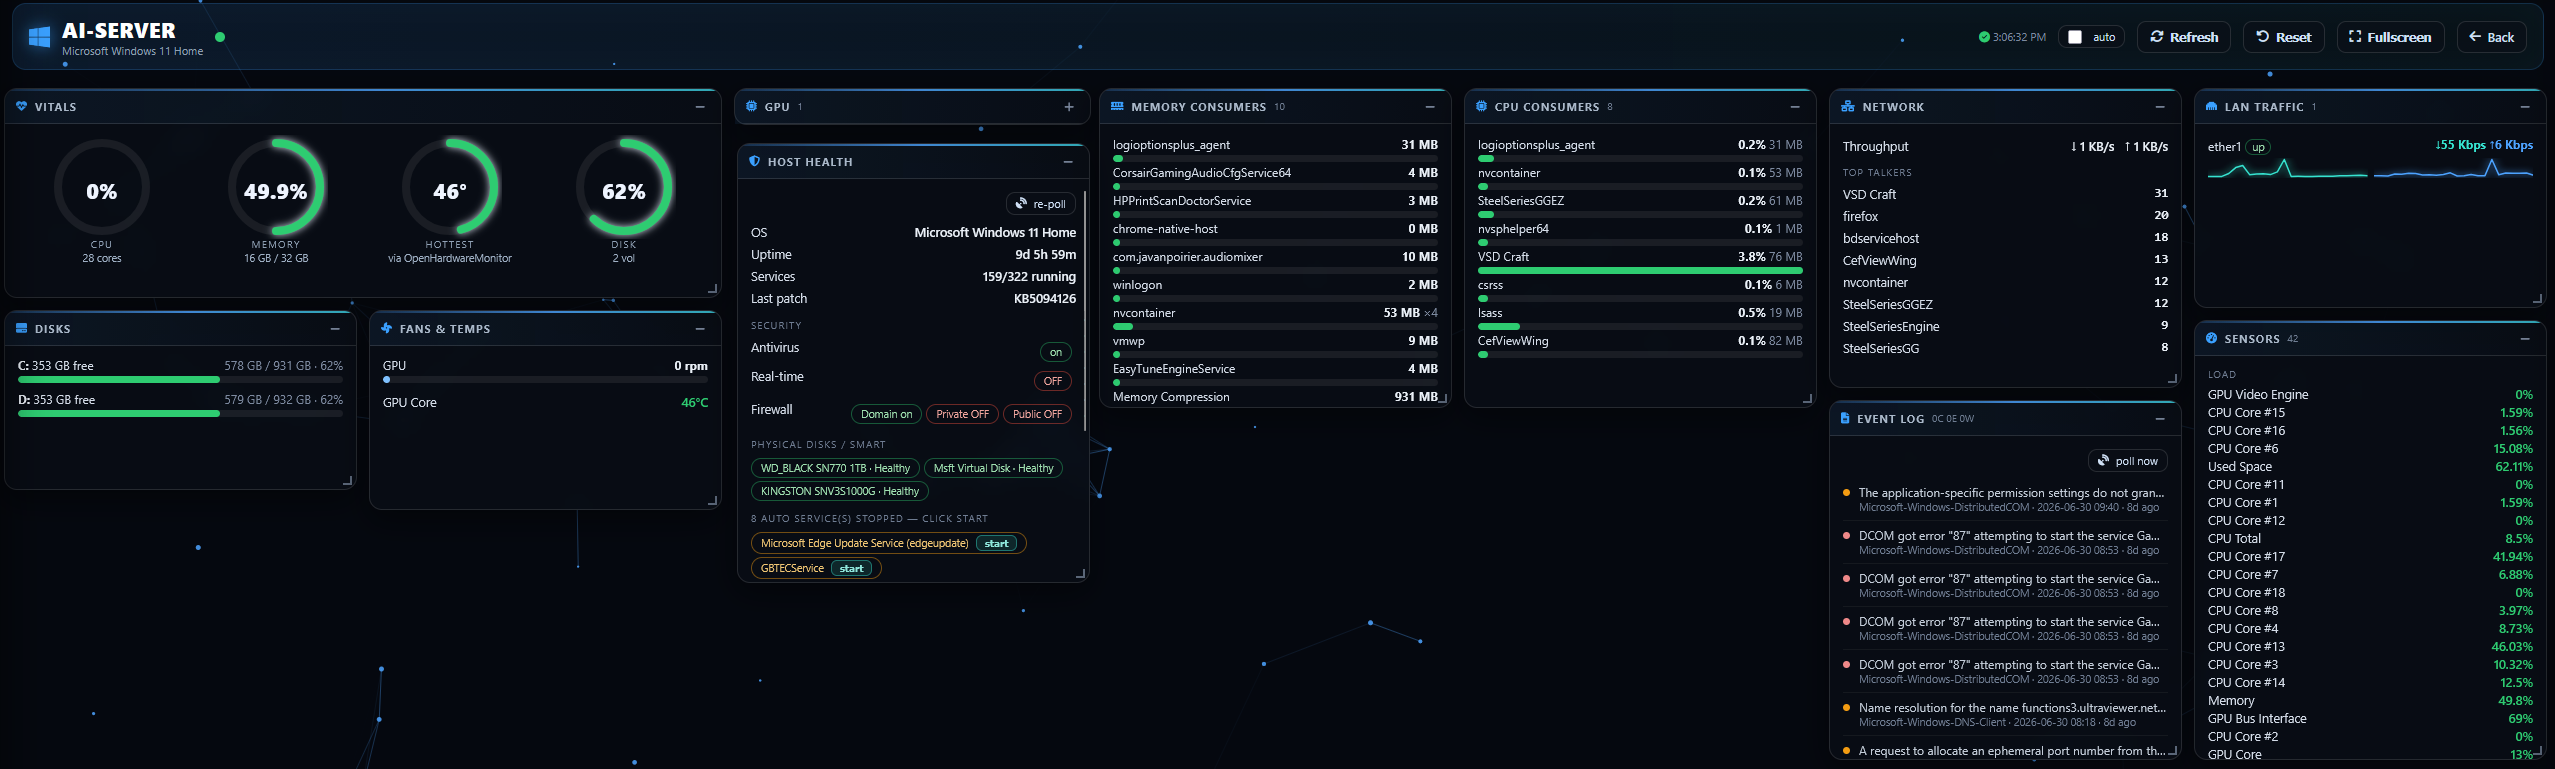
Windows Monitor
Agentless, over SSH — what’s eating CPU/RAM/disk/network on any Windows box, plus an immersive per-machine Command Center.
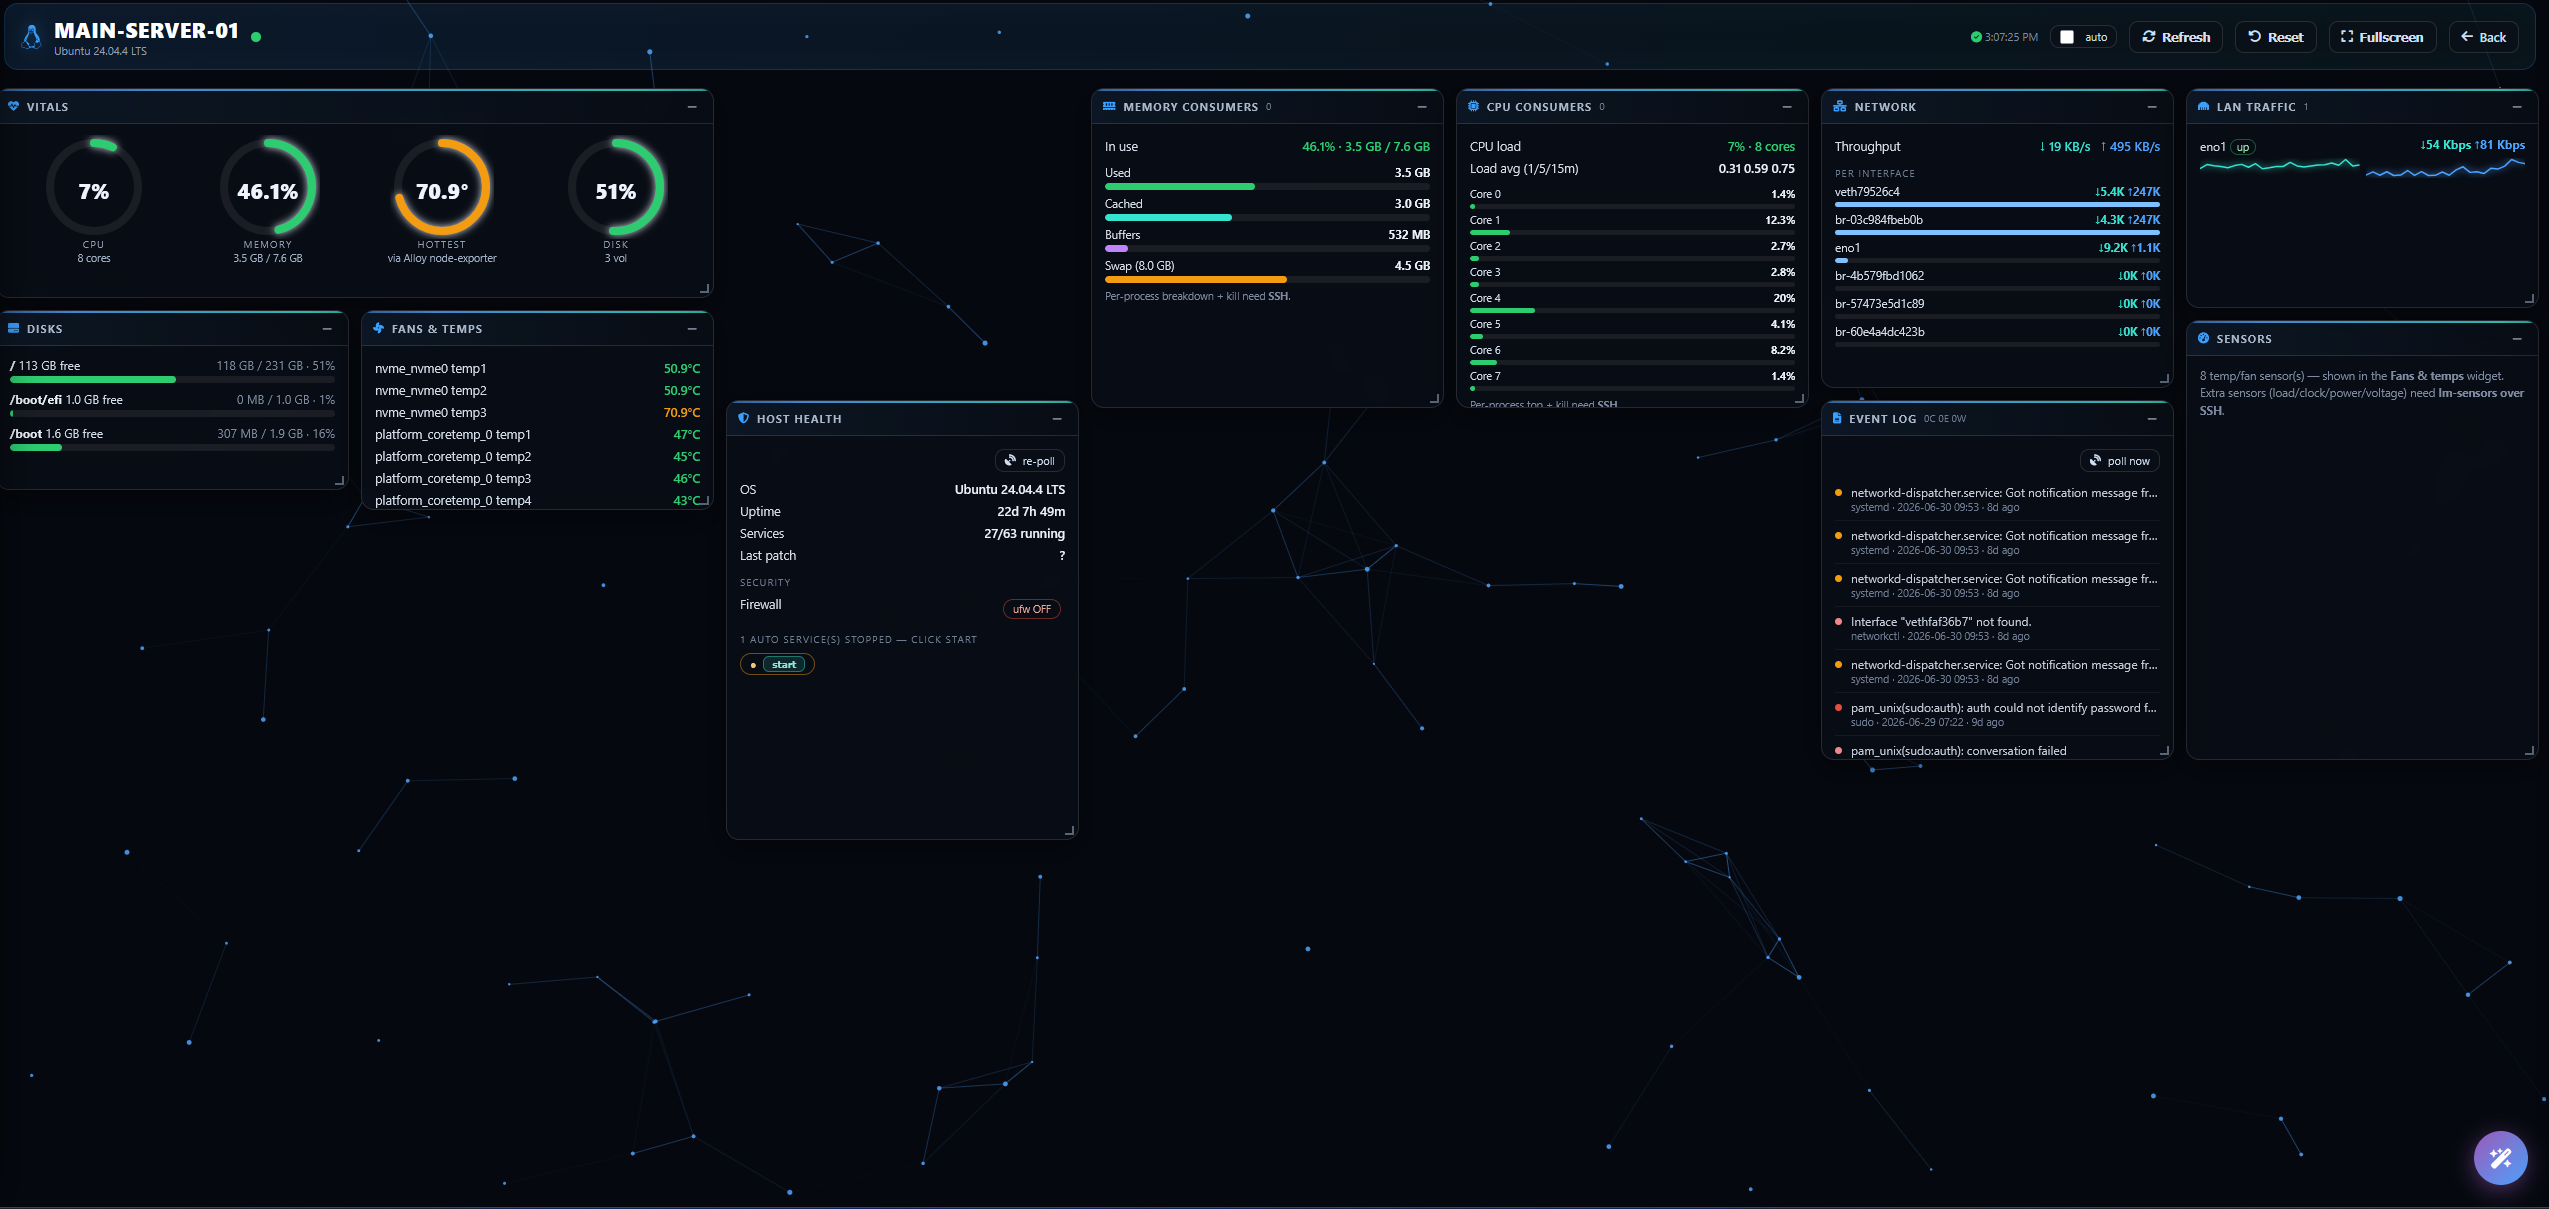
Linux Monitor
The same agentless deep-dive for Linux — top consumers, services, journal, temps, an instant verdict.
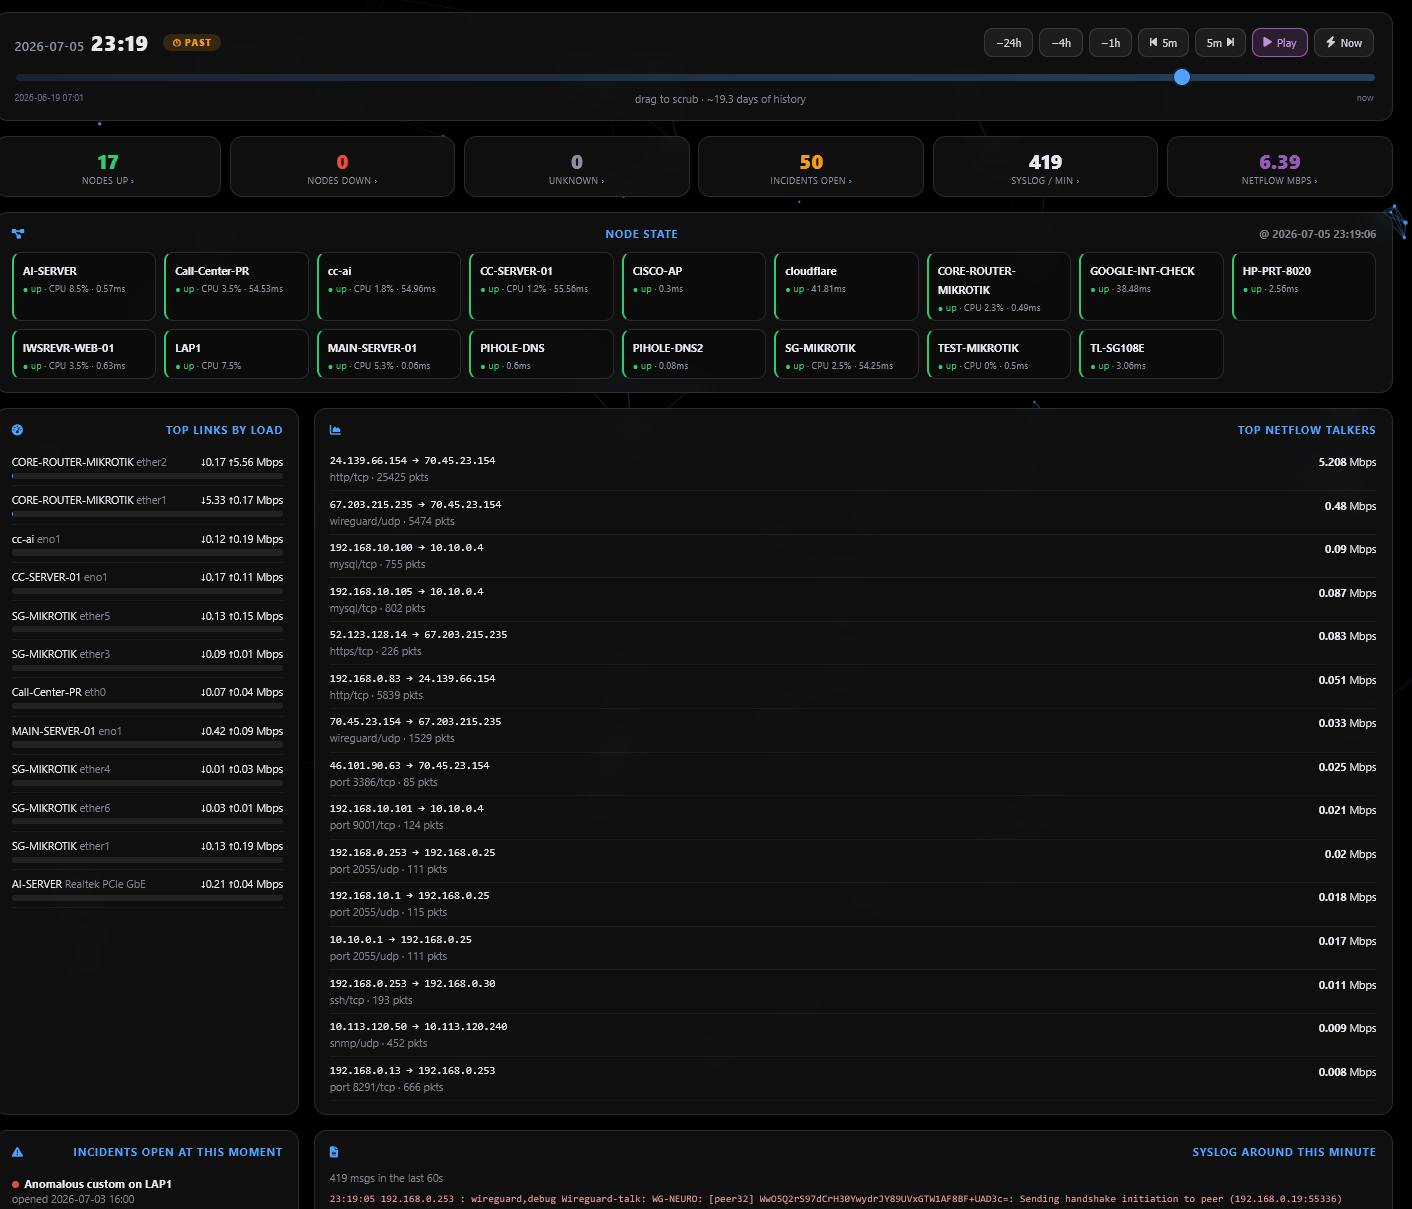
Time-Travel
Drag a slider and replay the entire state of your NOC at any past minute — nodes, links, flows, incidents, logs.
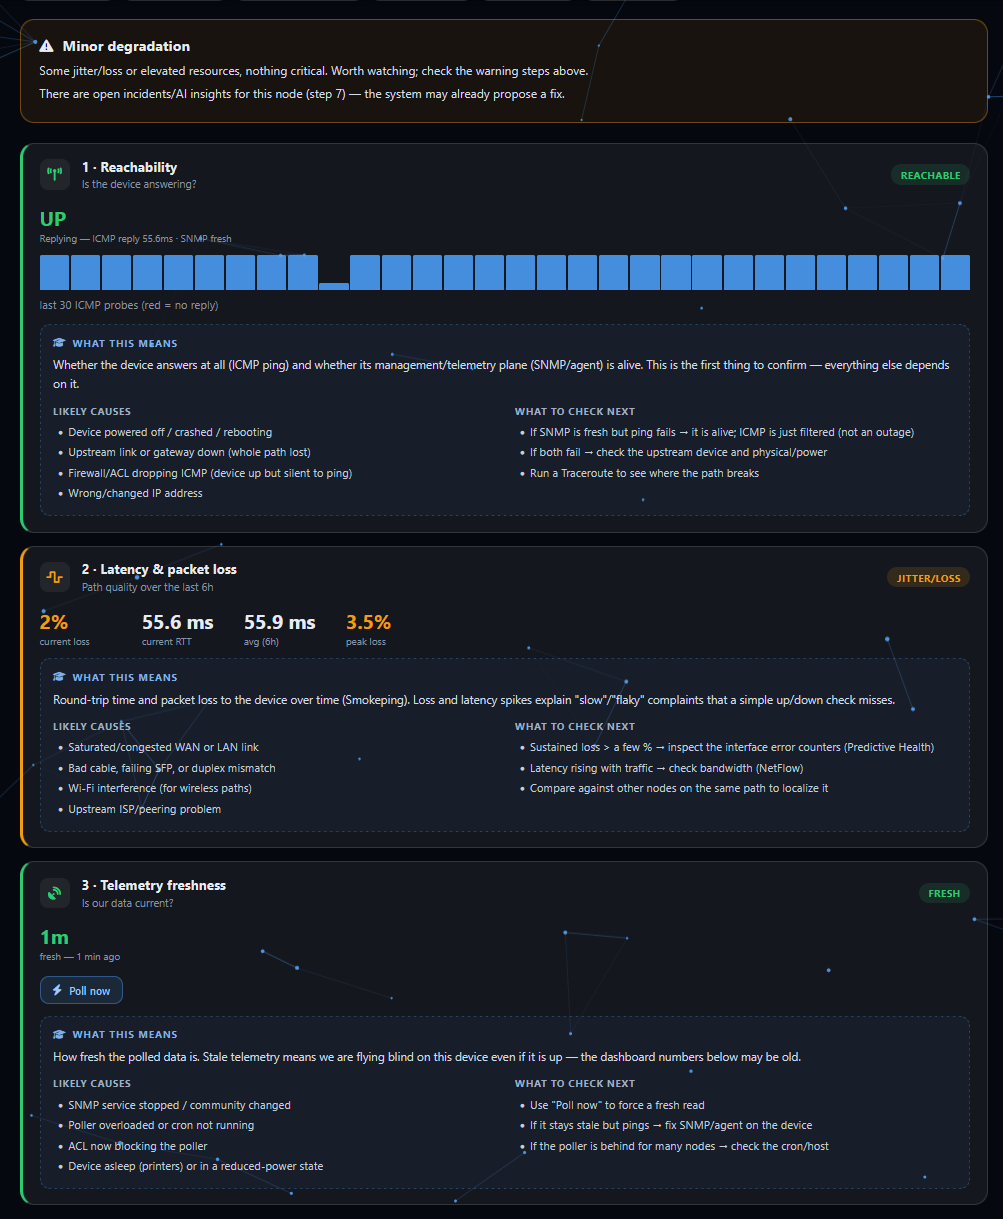
Troubleshoot Wizard
A guided, real-time investigator that correlates incidents and walks you to the root cause.
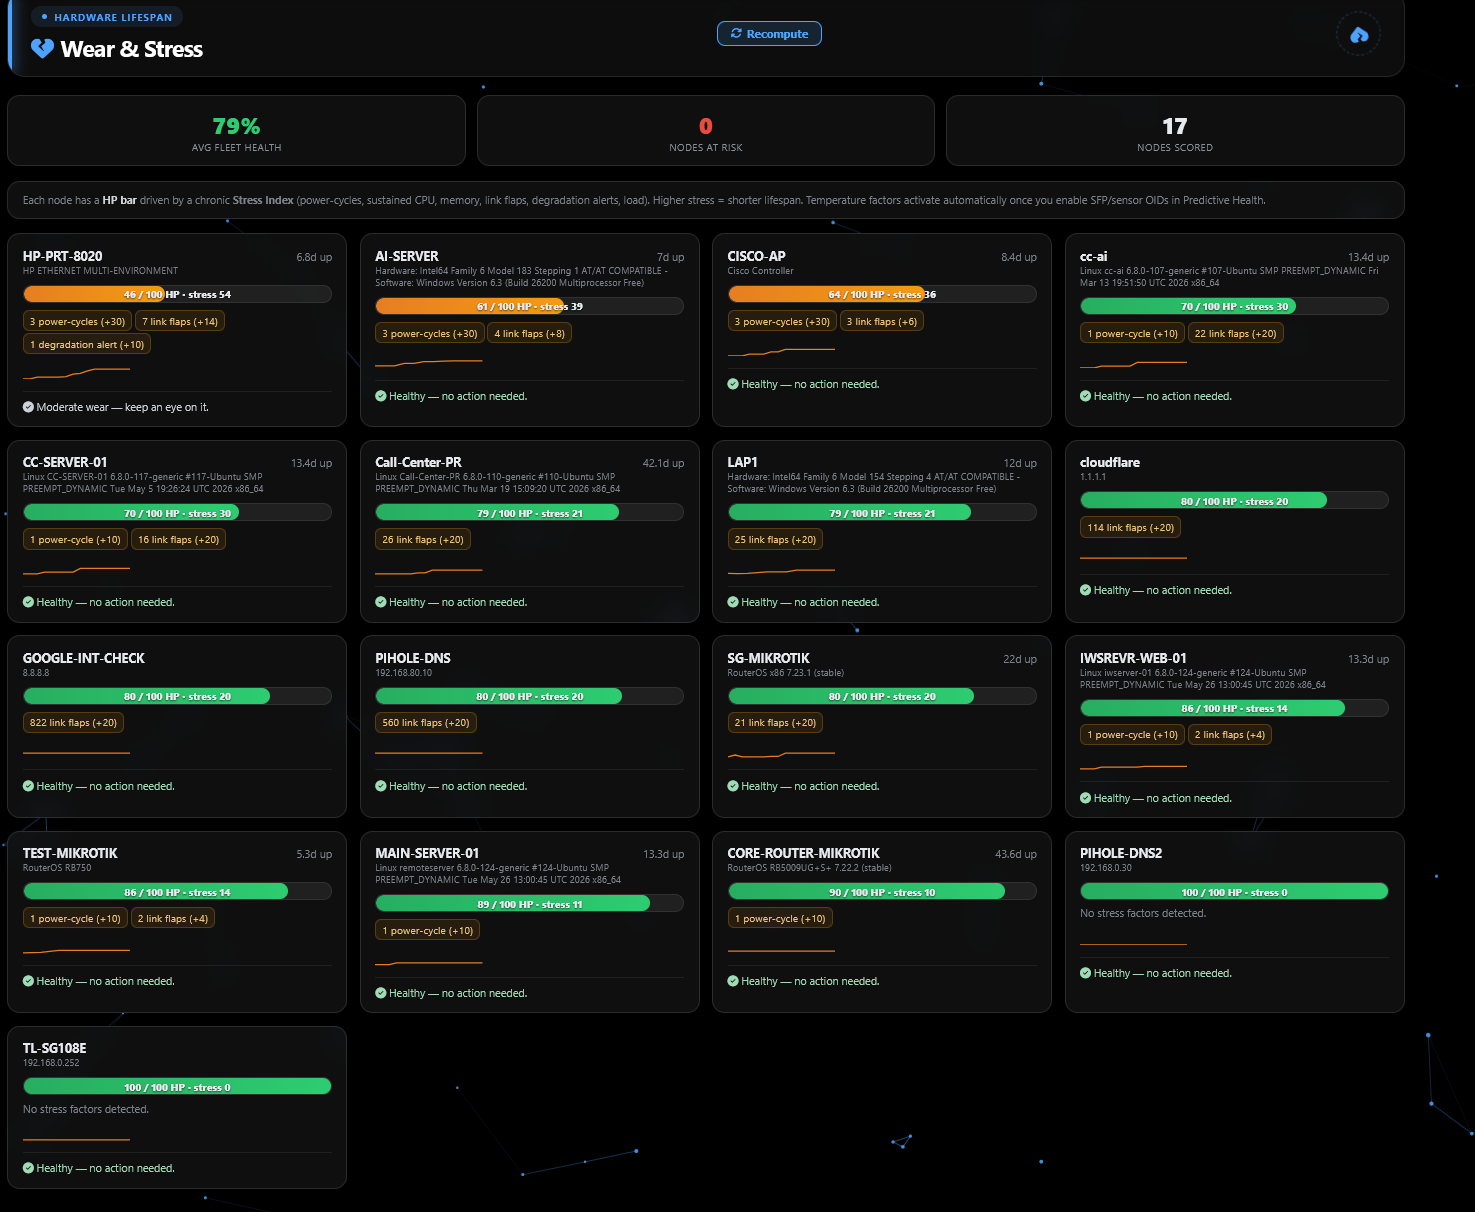
Wear & Stress
Which gear is running hottest and hardest — a fleet-wide stress map so you replace the right box first.
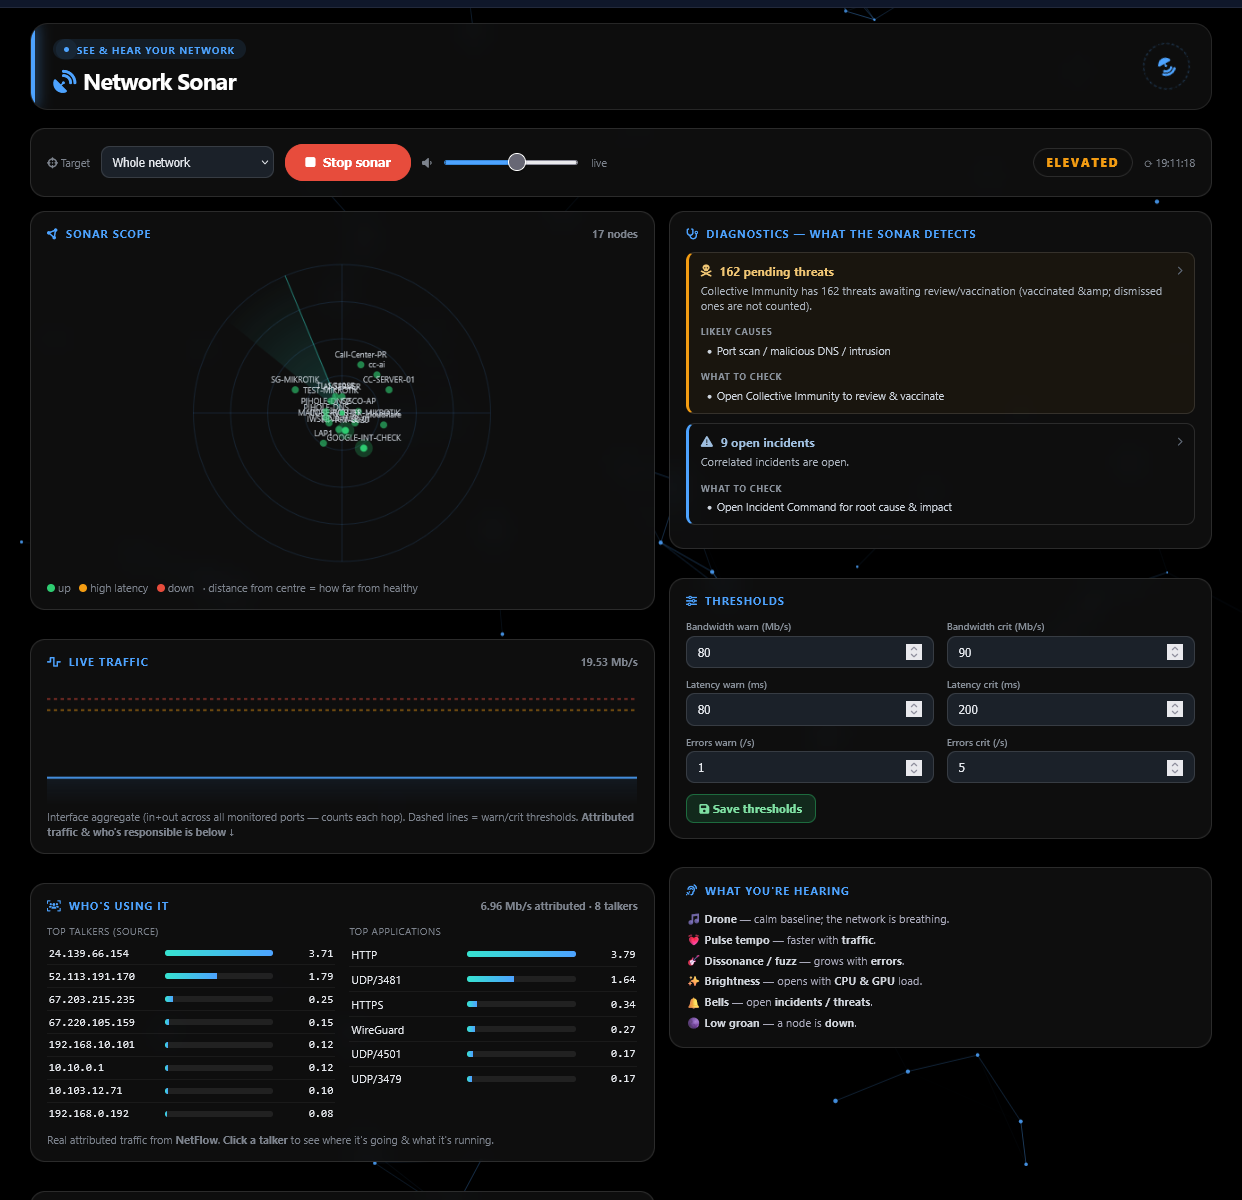
Network Sonar
Hear your network — ambient audio that makes anomalies audible while you work on something else.
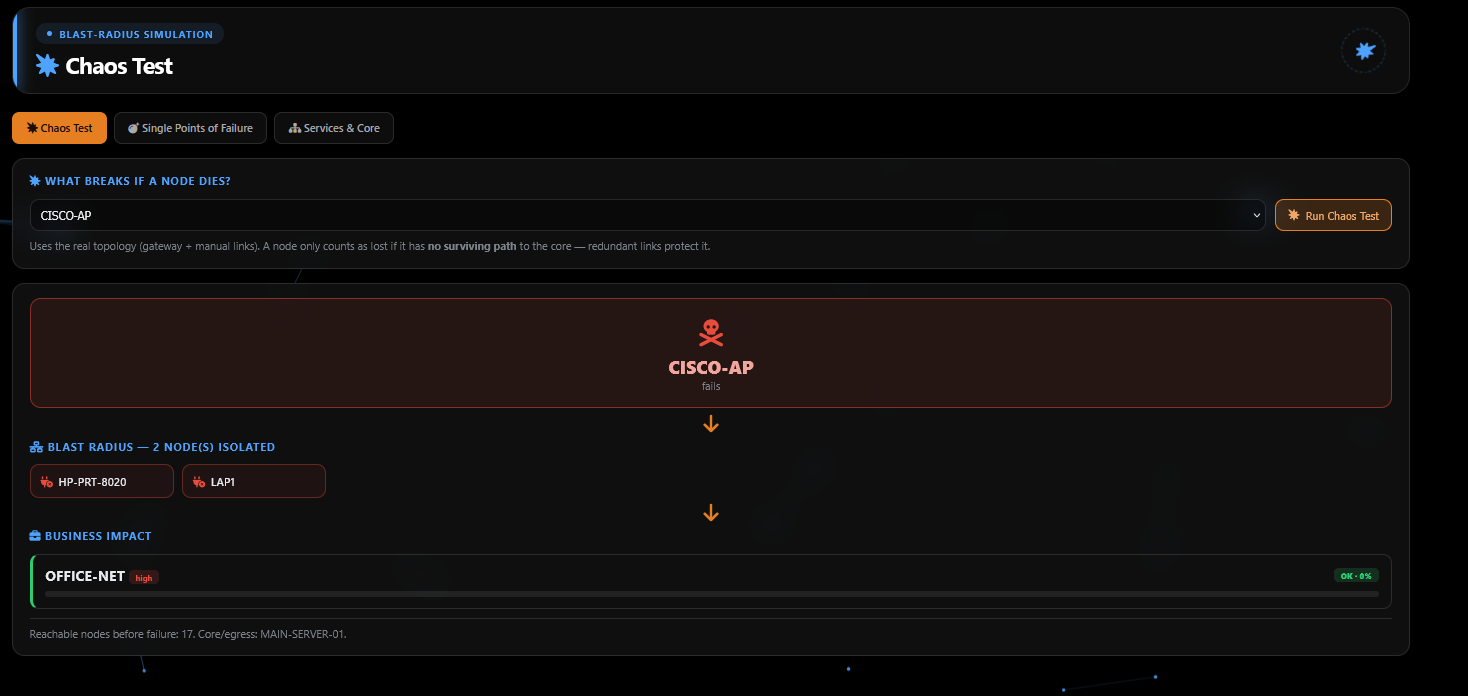
Chaos Test
Fail a node on paper and watch the blast radius cascade — find your single points of failure before reality does.
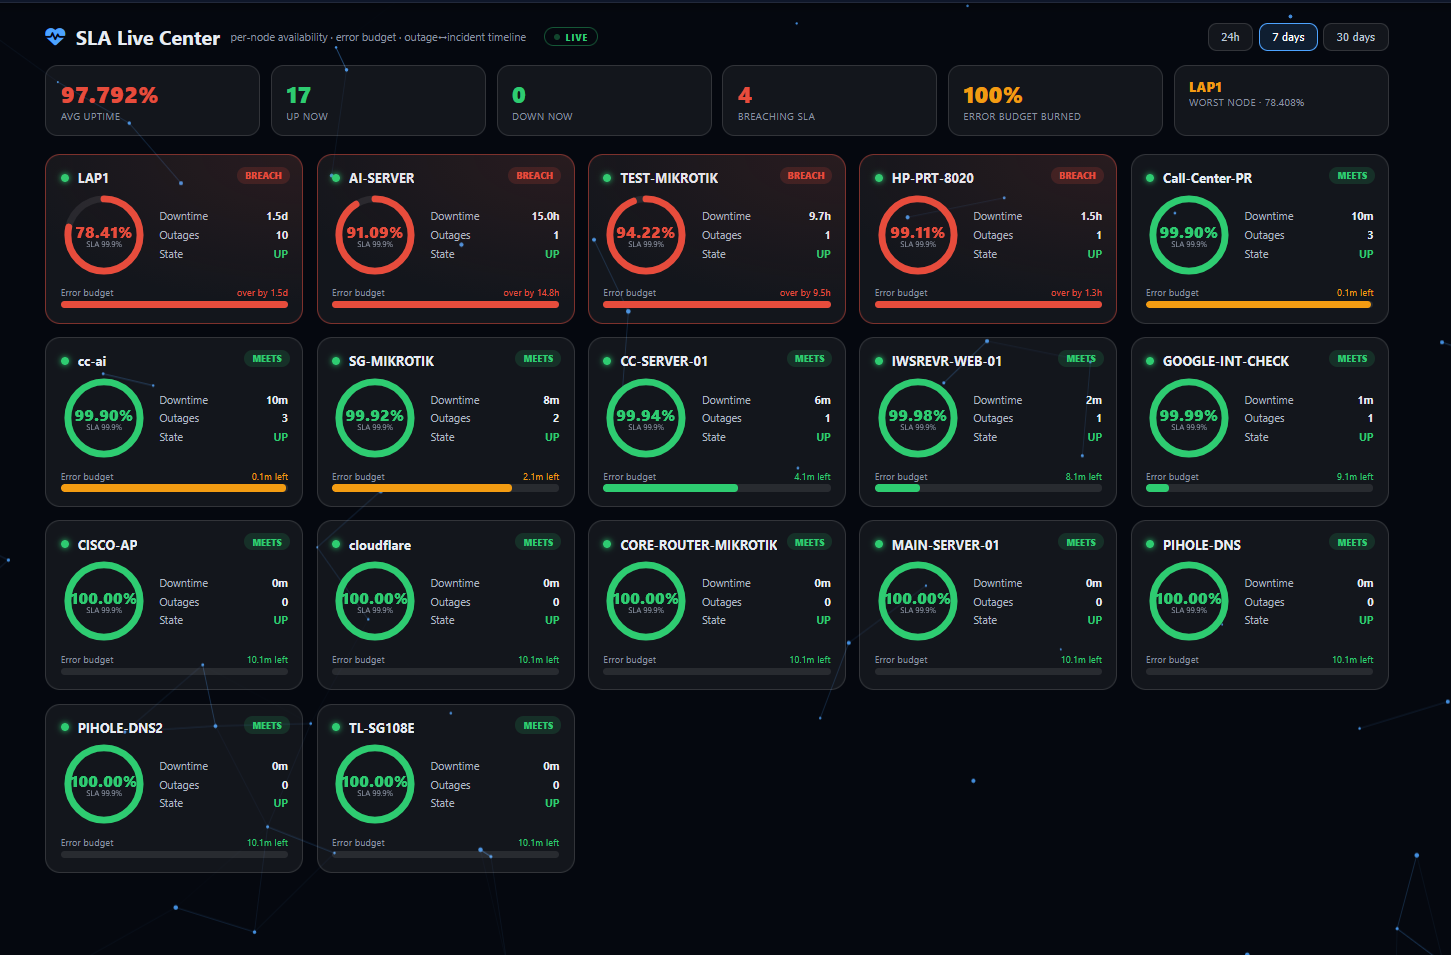
SLA Live Center
Per-node availability with error-budget bars and an outage-to-incident timeline — SRE-grade, at a glance.
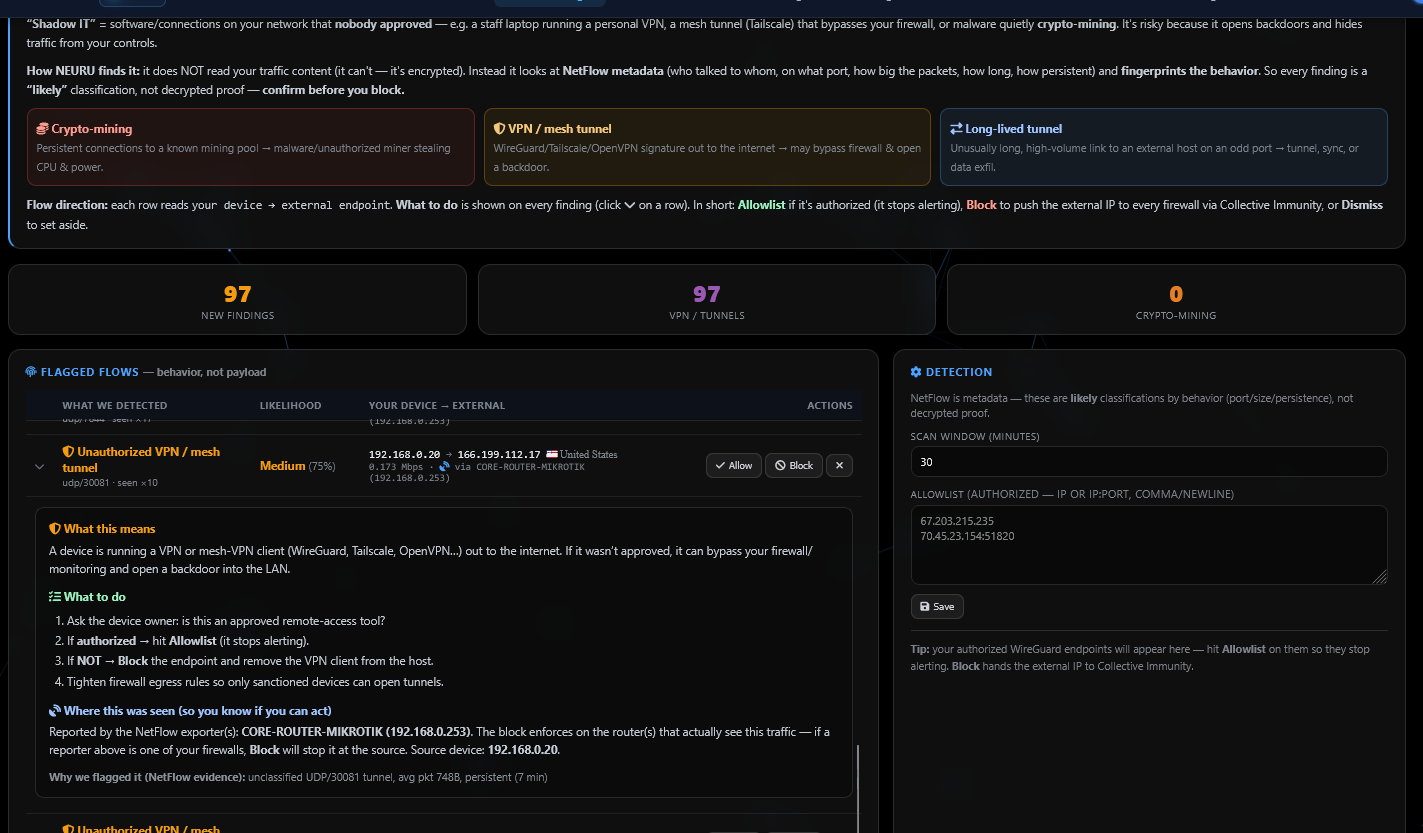
Shadow IT
Surfaces the devices and services nobody told you about — the unknowns become known.
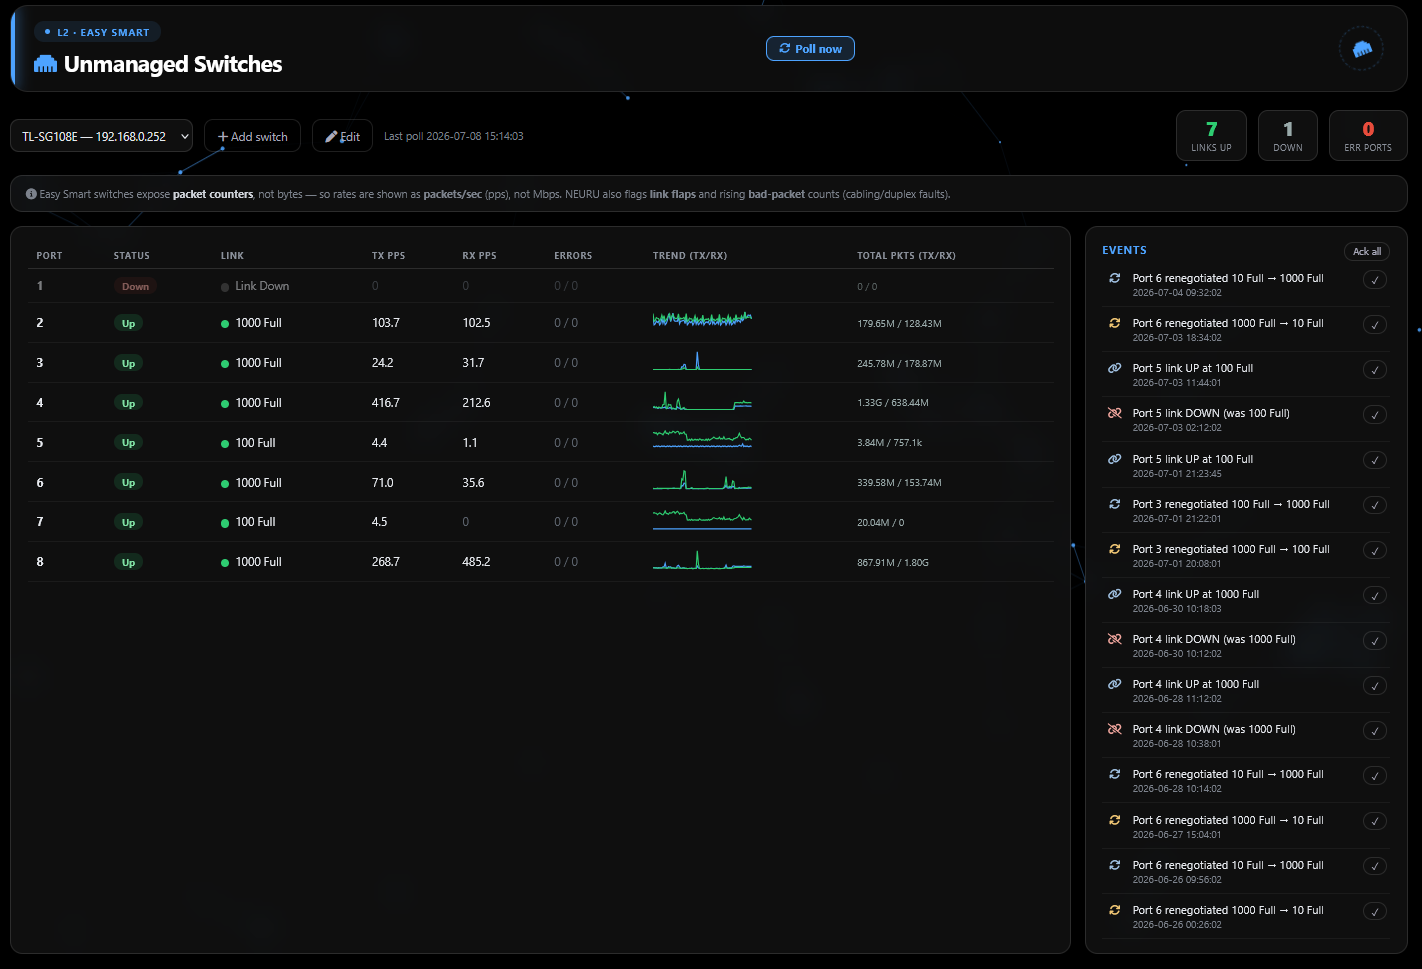
Unmanaged Switch Insight
Per-port visibility even on cheap web-only switches with no SNMP — link-flap and bad-packet alerts included.
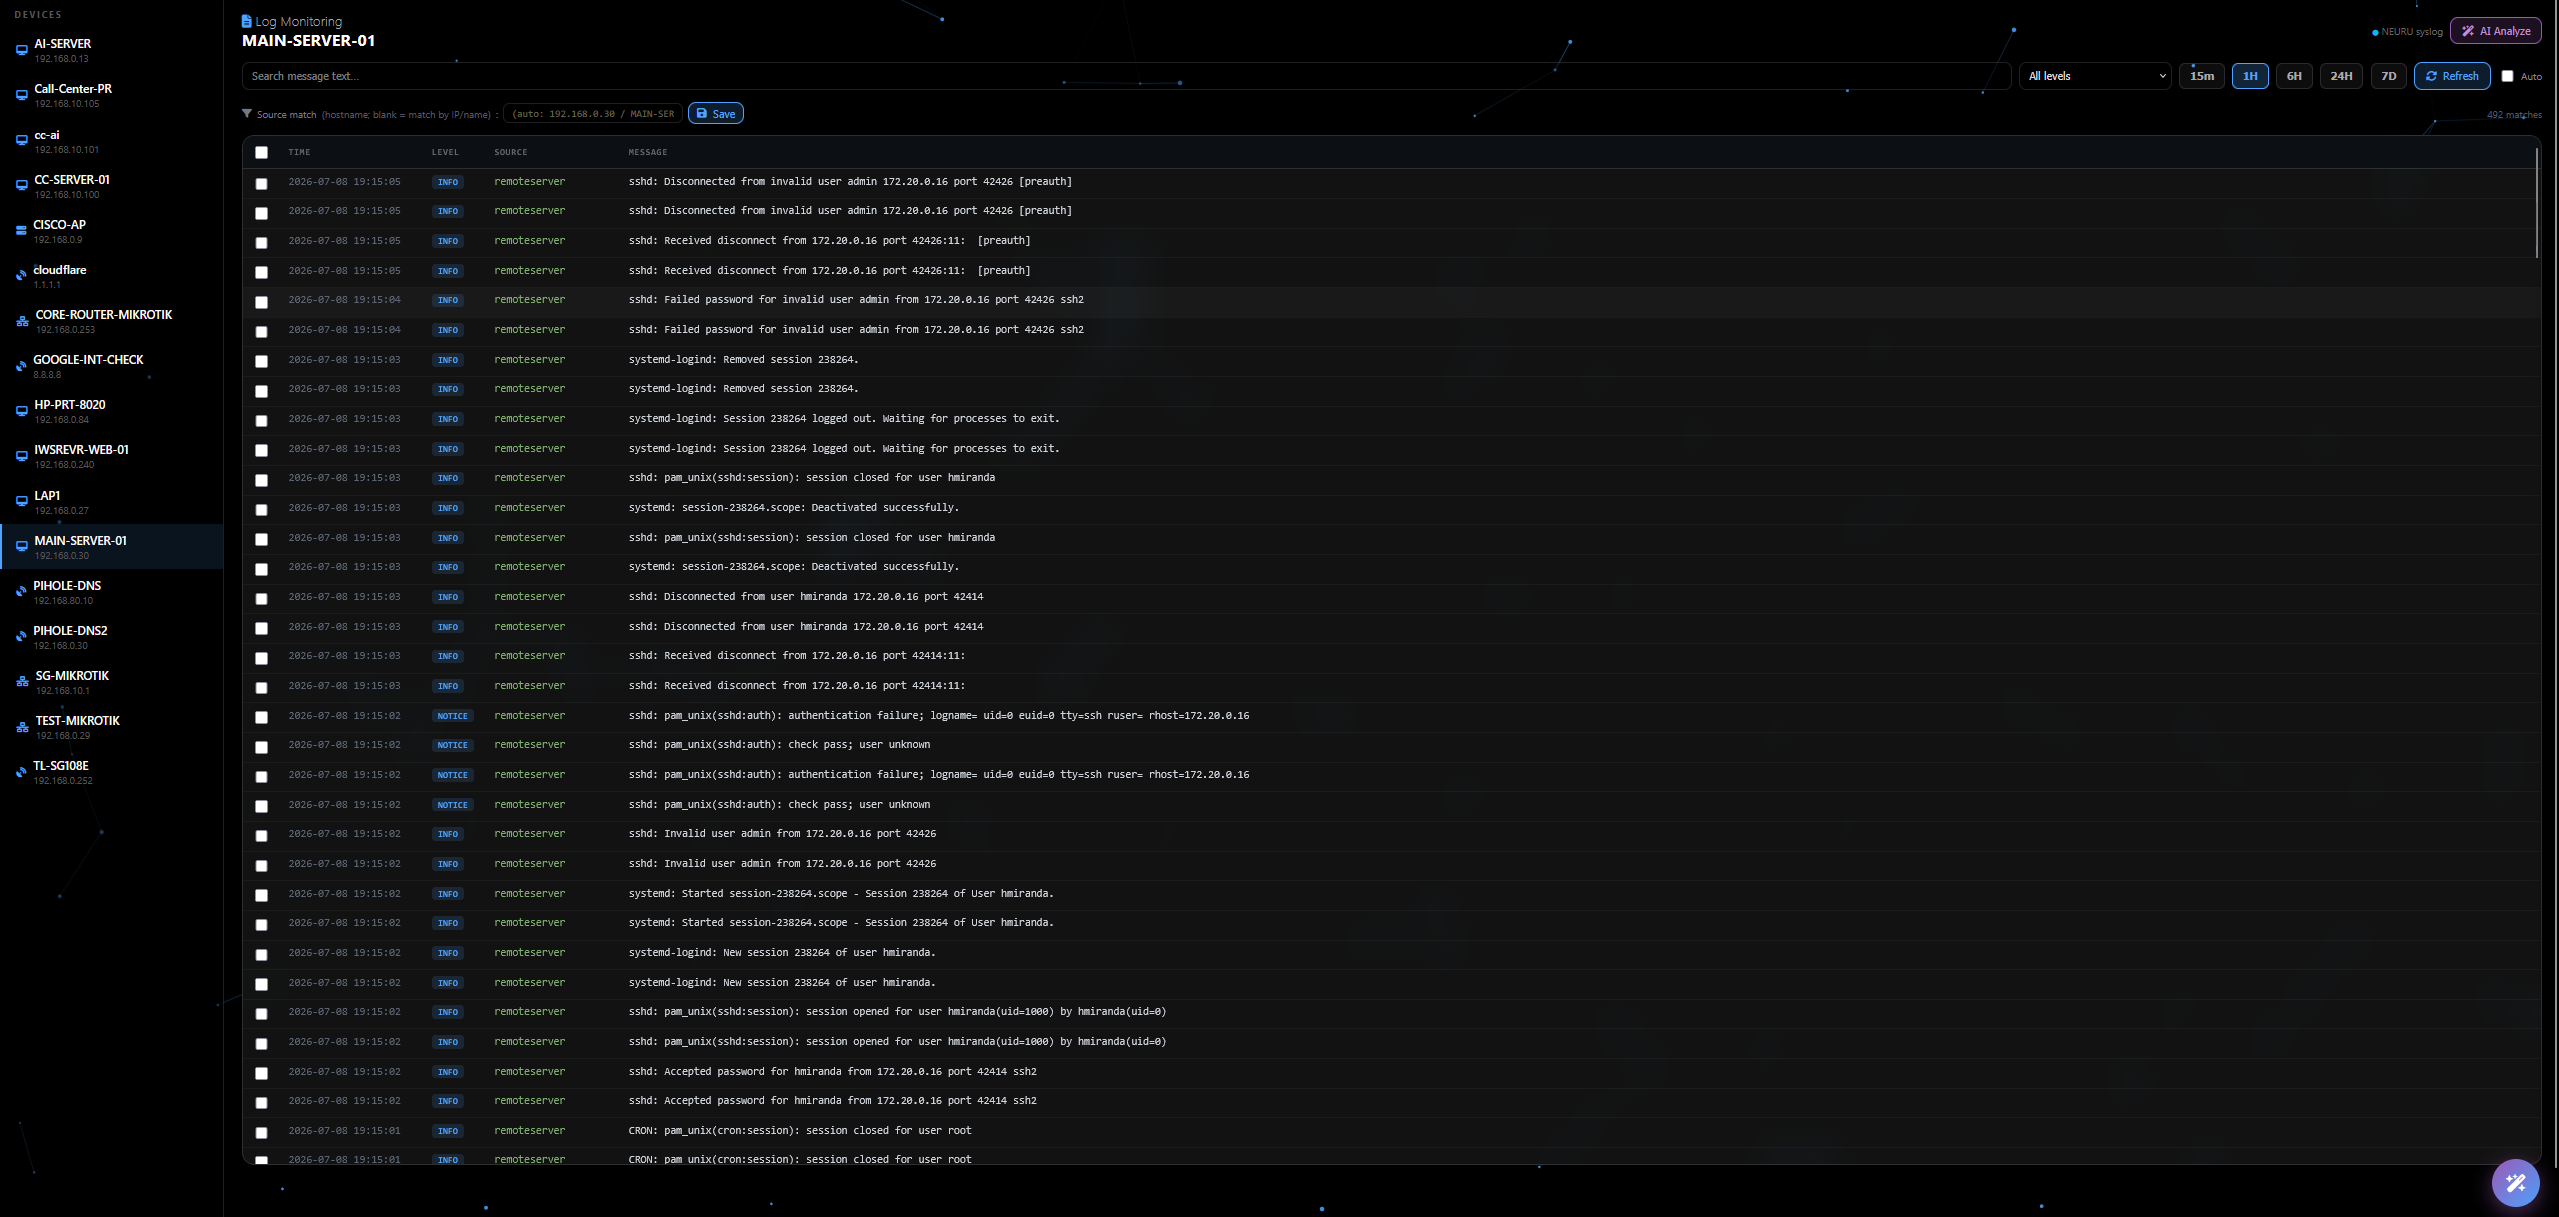
Unified Logs
Your own built-in syslog server — every device’s logs in one searchable place, live.
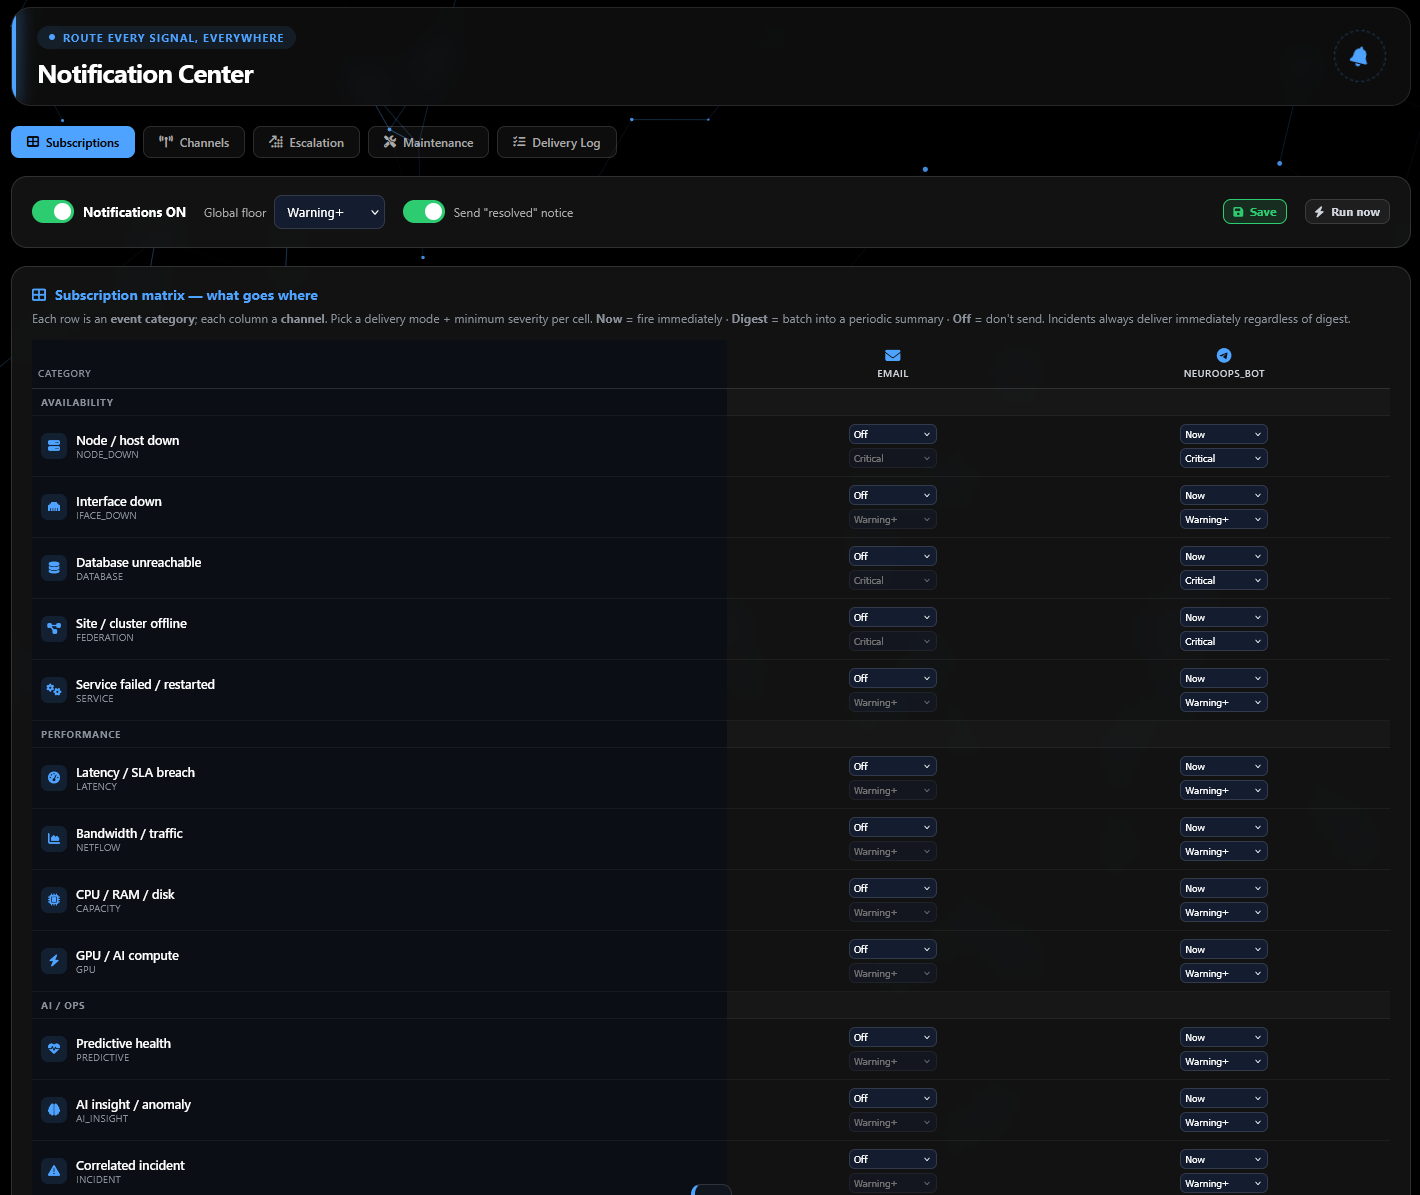
Notification Center
Every signal, routed anywhere. A Category × Channel matrix across 17 delivery channels — Telegram, Slack, Discord, Teams, PagerDuty, Opsgenie, email & more — with per-cell severity, immediate or digest. Criticals fire in seconds; rate-limits and digests keep it signal, not spam; a health badge warns you the moment a channel starts failing.
Intelligence & automation
NEURU doesn’t just show you data — it reasons about it, explains it in plain language, and can act on your behalf. This is where NEURU pulls away from a traditional NMS: an AI that doesn’t just alert, it investigates and helps resolve.
AI Command Center
An autonomous AI operator that watches the exact devices you choose, thinks through what it sees, and takes action — with Telegram approvals and a full audit trail. Observe, co-pilot, or full autopilot; you hold the leash. Monitoring that actually does something about what it finds.
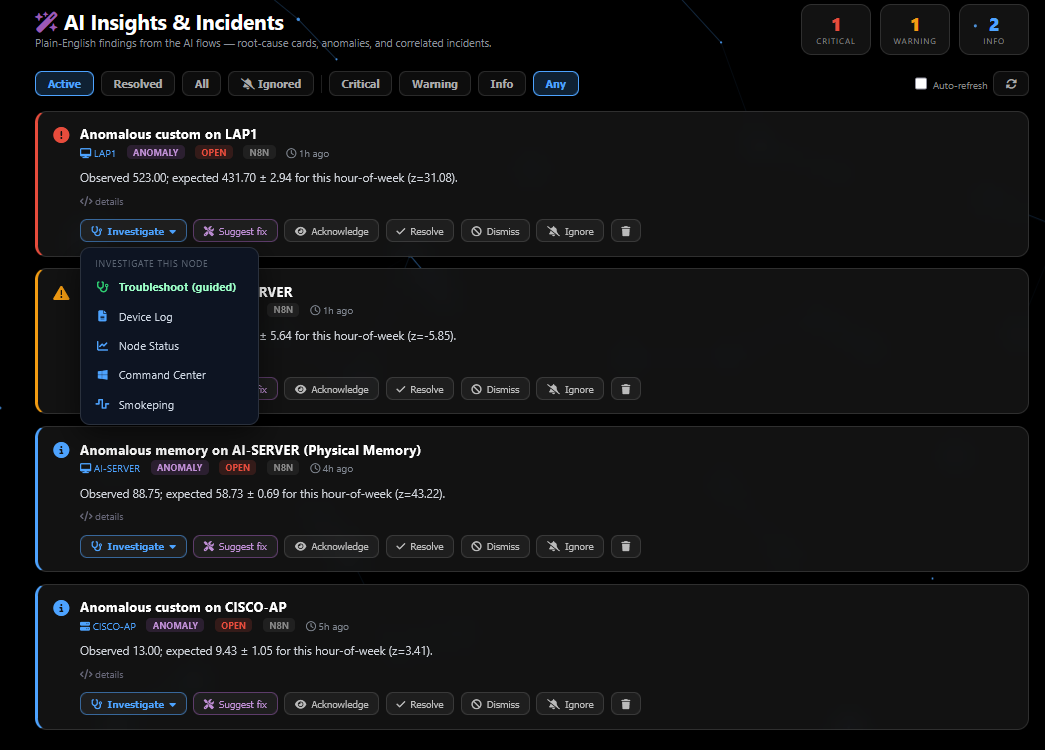
AI Insights
Plain-English anomaly detection and root-cause narratives — the “why,” not just the “what.”
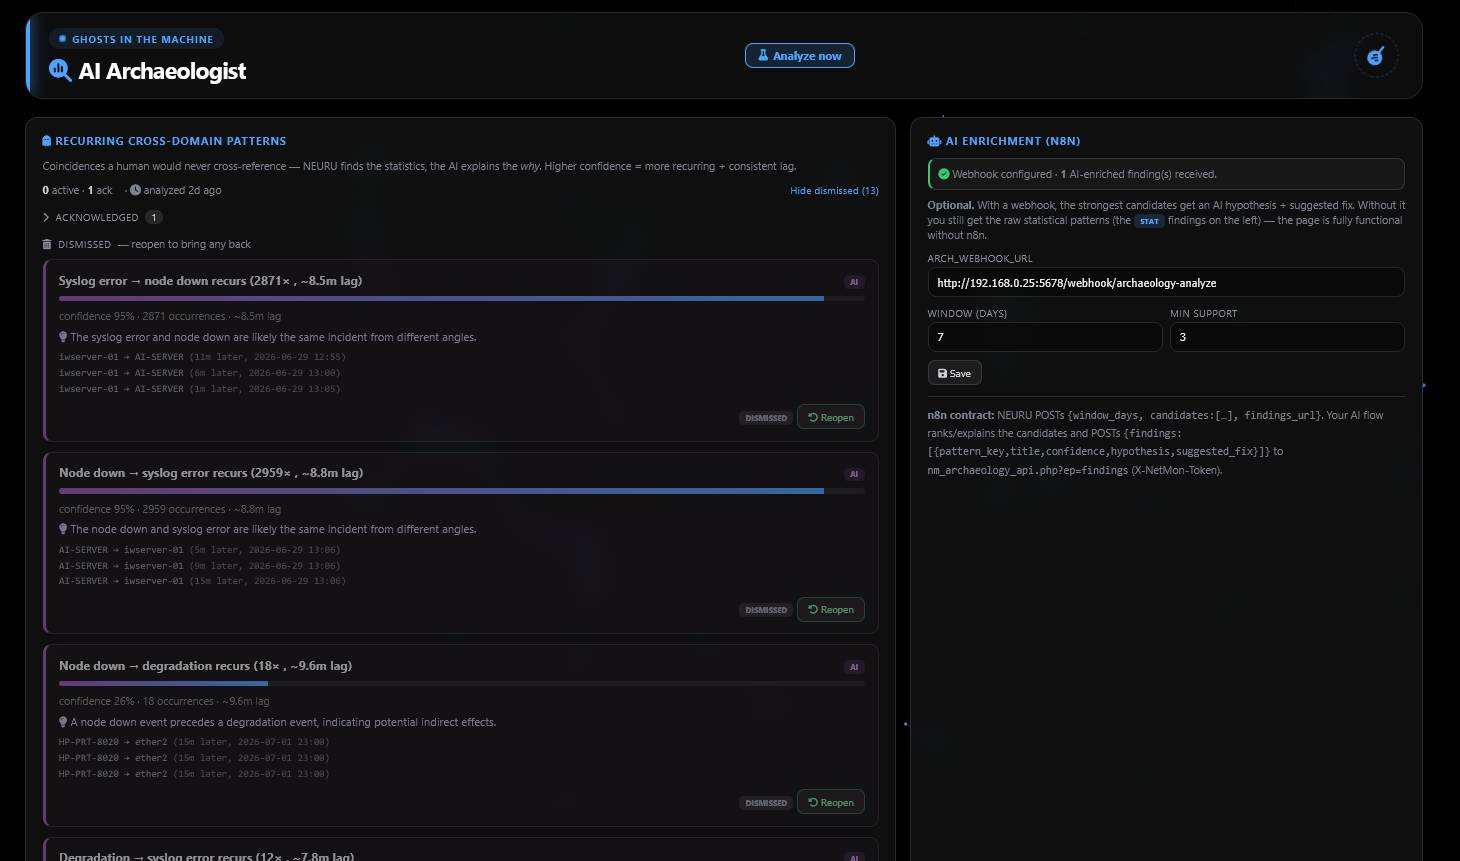
AI Archaeologist
Digs through your history to explain how you got here — the story behind a slow-burn problem.
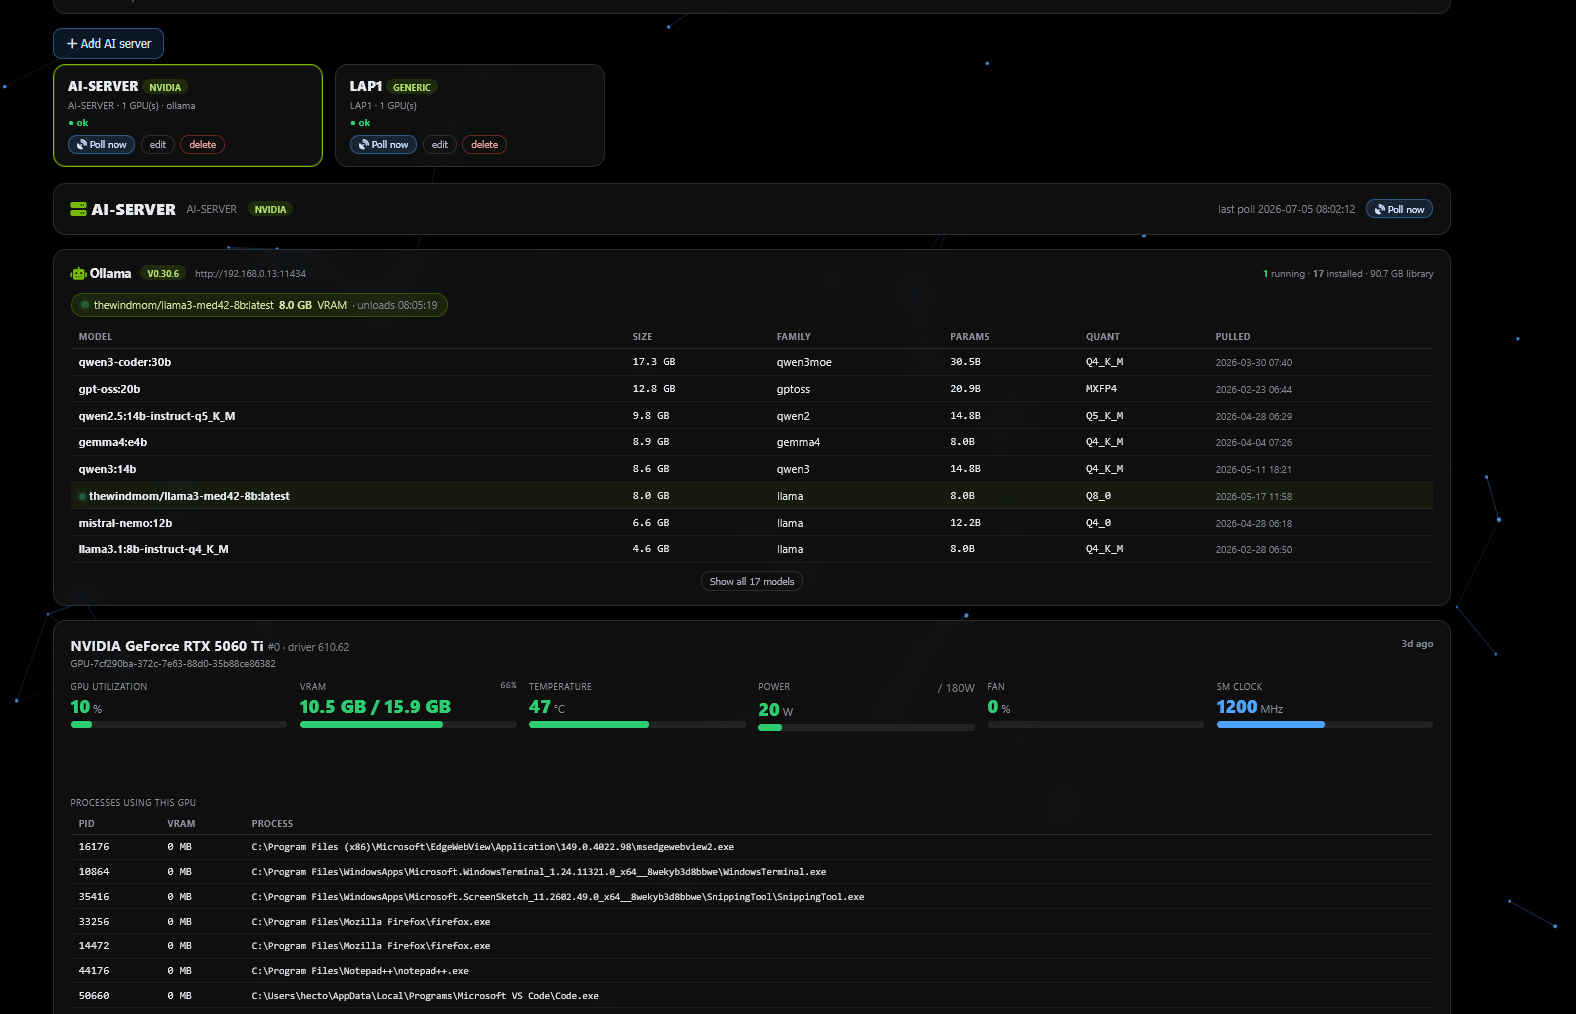
AI / GPU Monitor
Agentless telemetry for your GPUs and local LLM stack (Ollama & friends) — utilization, memory, models, all over SSH.
Adv. Solution Commander
AI-over-SSH troubleshooting for routers and Linux — it investigates the live device, explains its reasoning first (a safe dry-run), guards destructive commands, and only acts when you say so. A senior network engineer, on call, inside your NOC.
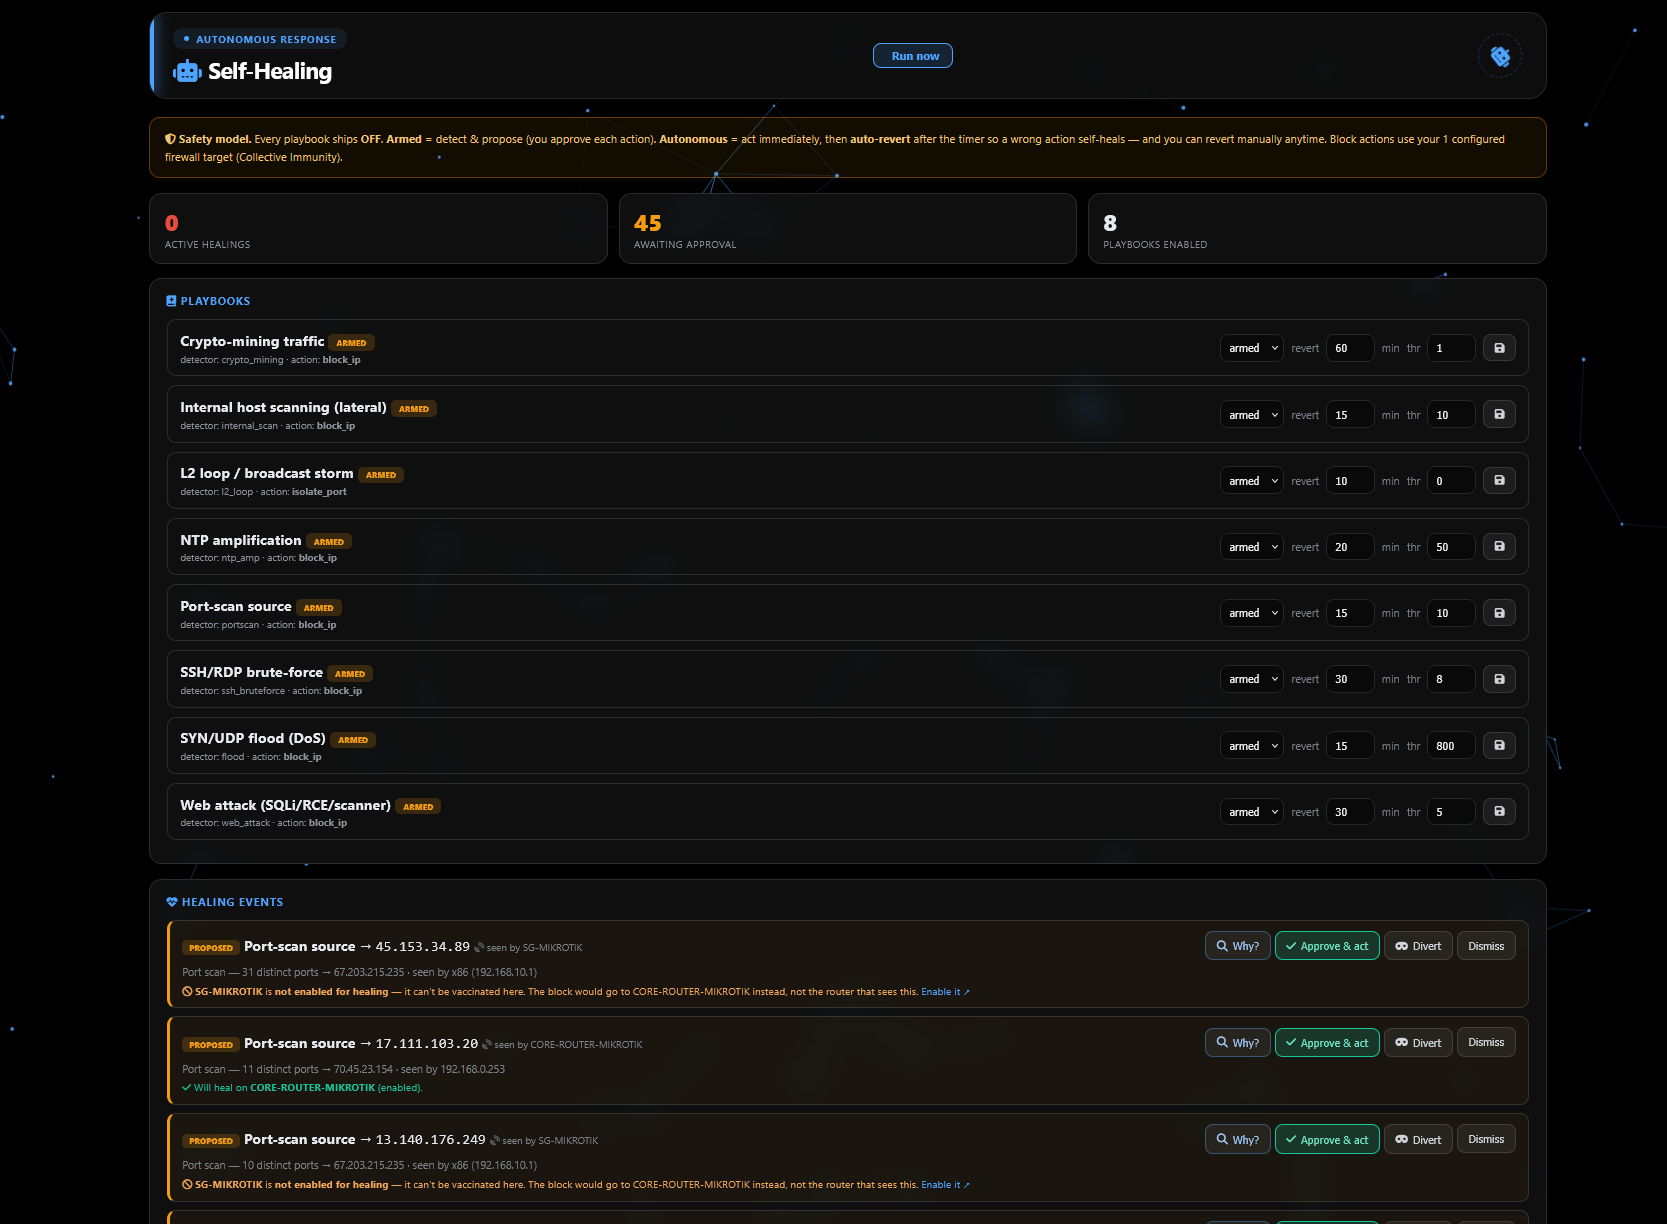
Self-Healing
Detect → propose → act → auto-revert playbooks. Time-boxed and safety-first — it fixes, and un-fixes itself if it’s wrong.
Defend & self-heal
A network with an immune system. Detect a threat once and your whole fleet learns from it — automatically.
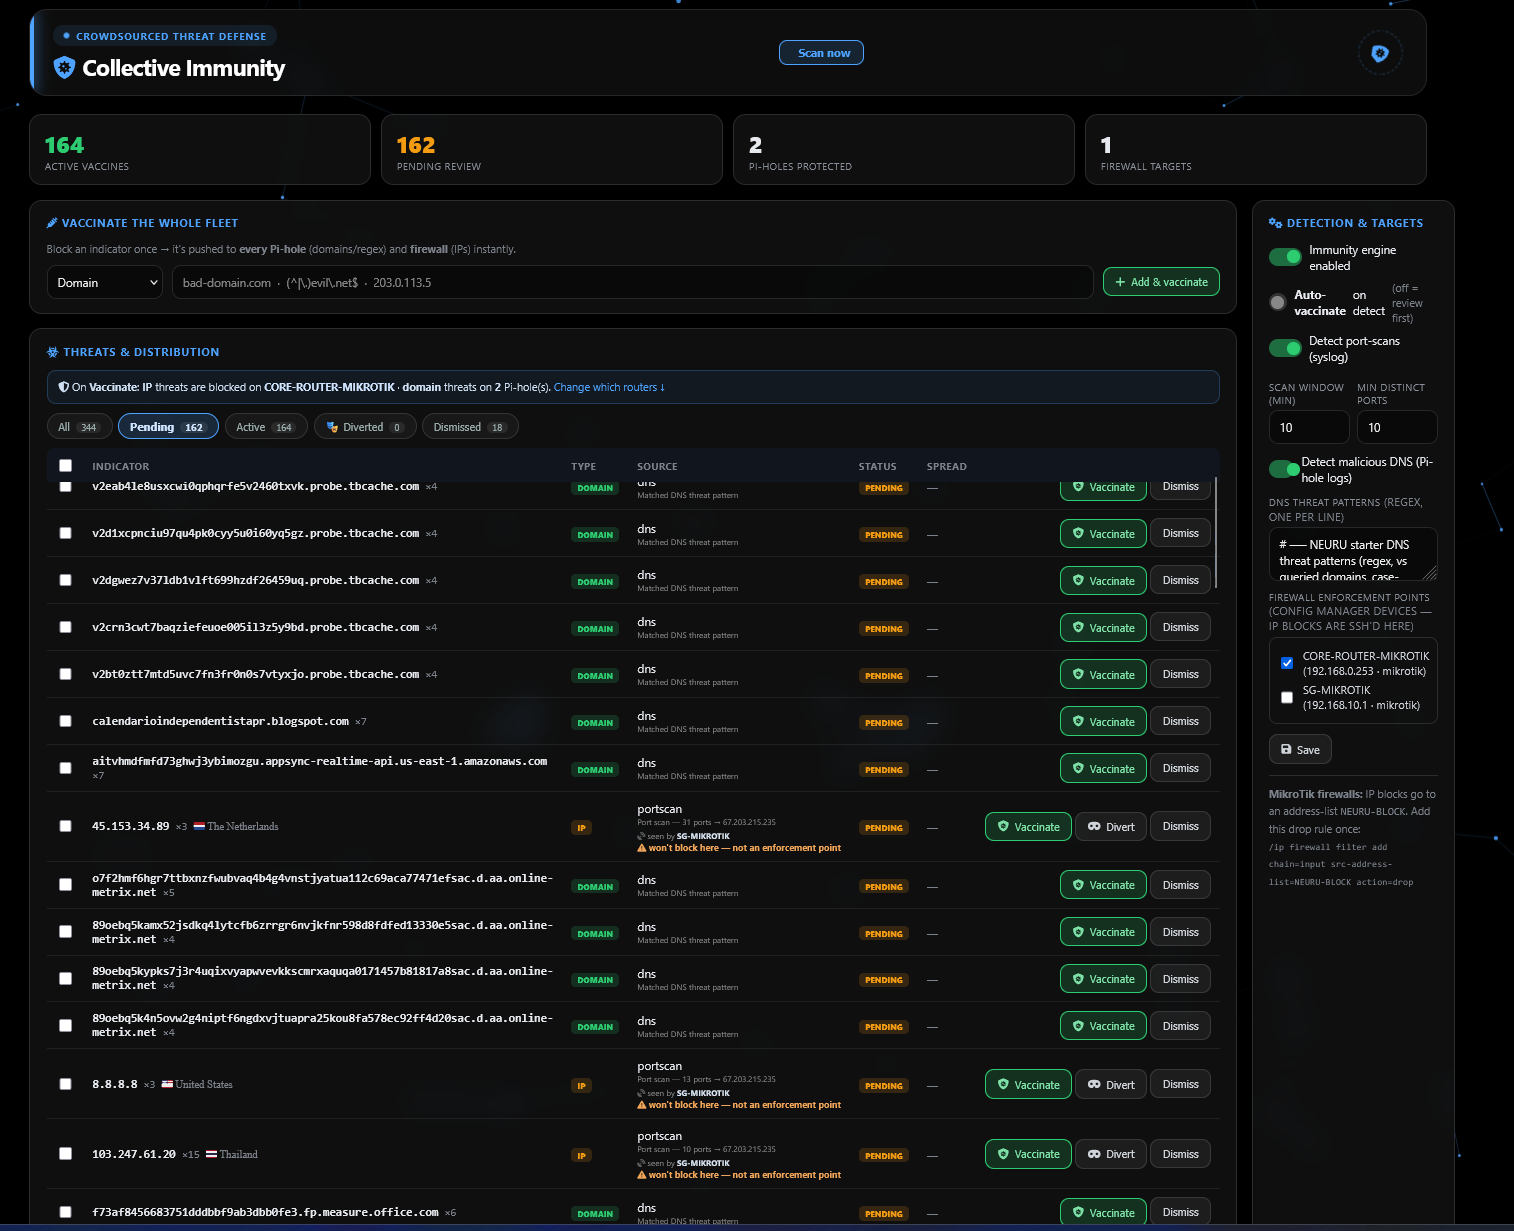
Collective Immunity
Block a bad actor on one box and it fans out to every Pi-hole and firewall across your fleet, instantly. One decision, whole-estate protection.
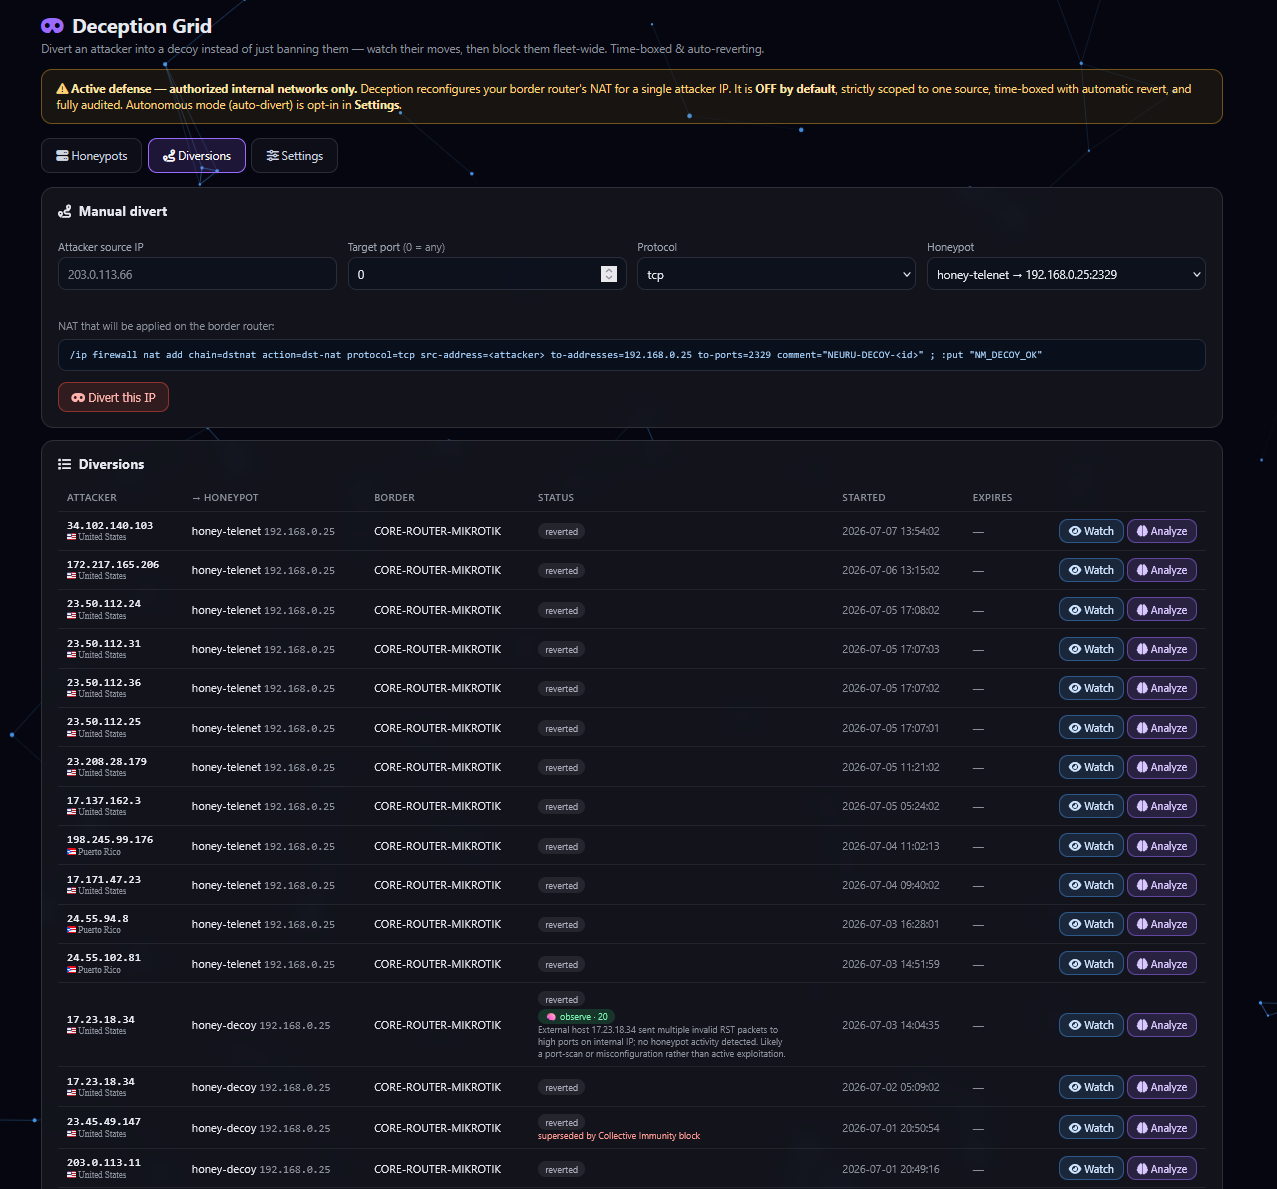
Deception Grid
Divert an attacker into a decoy honeypot, watch them, then promote the block fleet-wide. Time-boxed and auto-reverting.
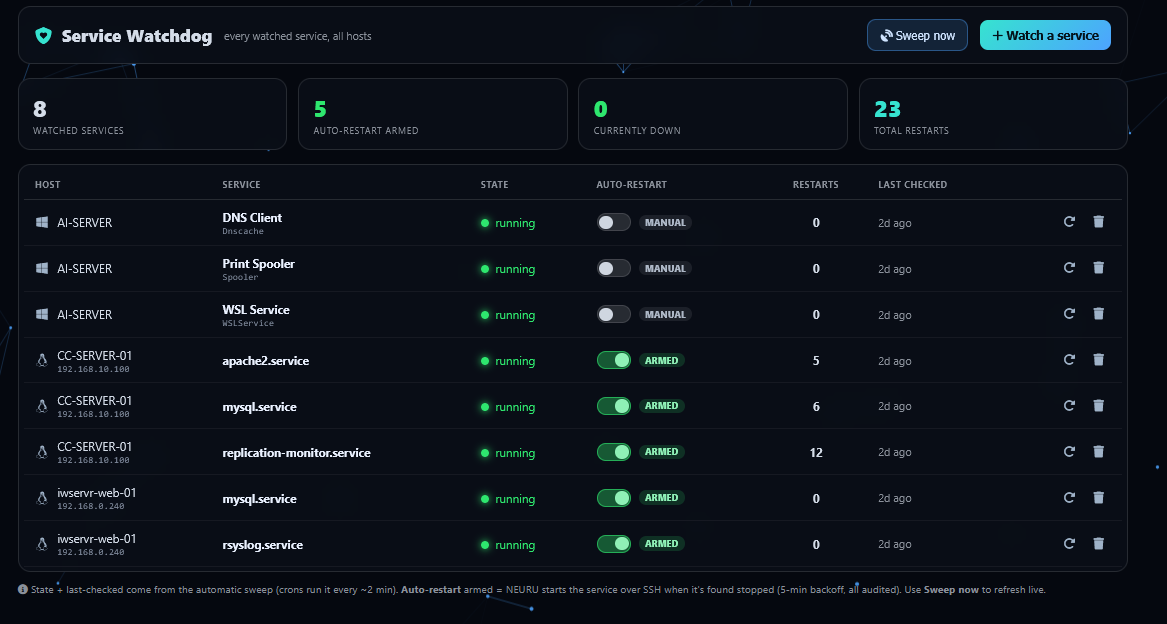
Service Watchdog
Every watched service across Linux & Windows in one cockpit — with auto-restart when something dies.
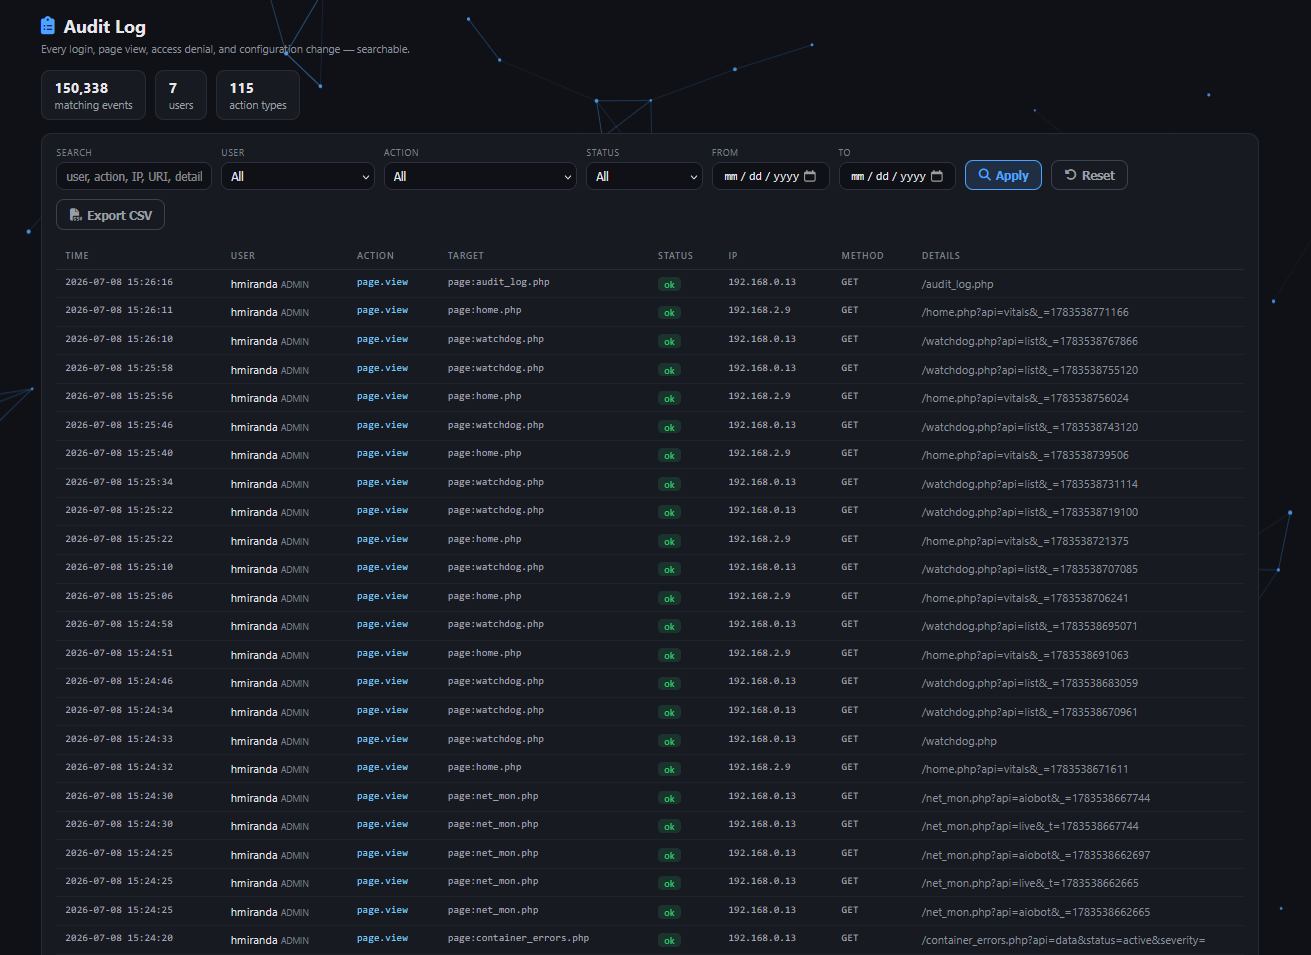
Audit Everything
Every action, by every user, recorded — accountability you can hand to an auditor.
Take control
Not just watching — doing. Configure, secure, and drive your gear directly from NEURU, safely. Some tools speak a specific vendor’s language deeply — those are marked.
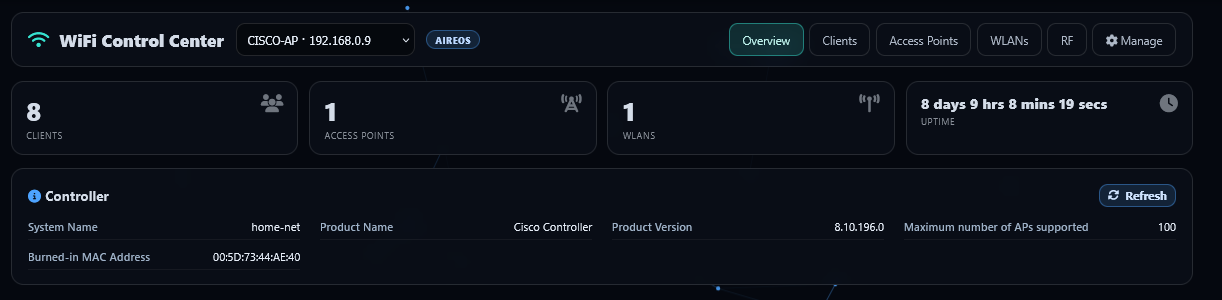
WiFi Control Center Cisco AP live
A driver-based SSH cockpit for wireless controllers: live clients, APs, WLANs & RF, plus deauth, block and reboot. Ships with a live Cisco AireOS / Mobility Express driver, with slots for 9800, Aruba, UniFi & MikroTik CAPsMAN.
MikroTik Firewall / Device Manager MikroTik only
A visual, object-based /ip firewall editor with anti-lockout Safe-Apply — commit-confirm auto-rollback so a bad rule can never lock you out — plus a what-if simulator, templates and drift detection.
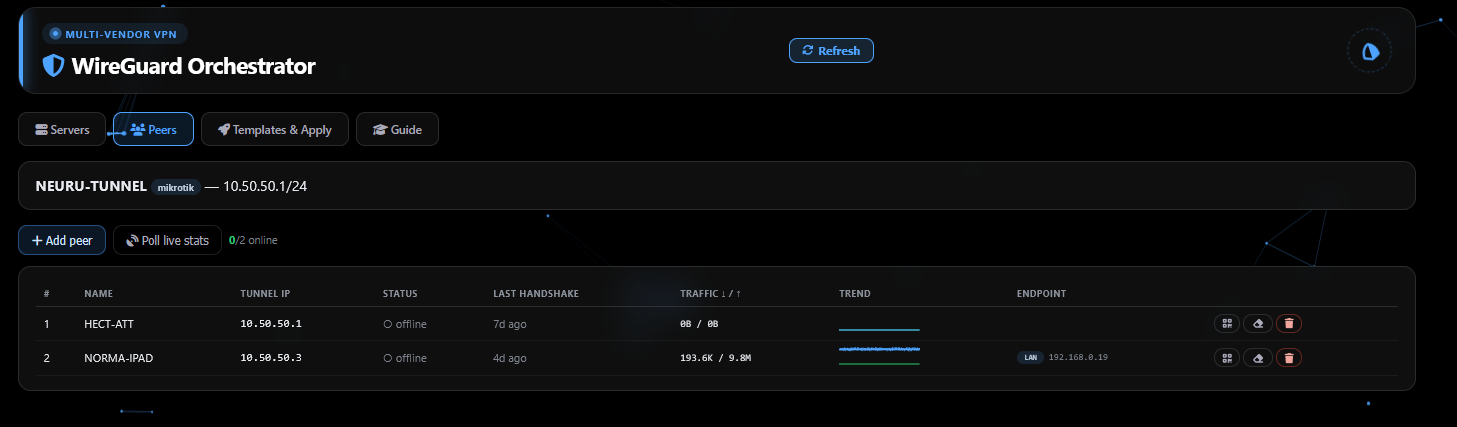
WireGuard Orchestrator Multi-vendor
Stand up multi-vendor VPN tunnels with QR onboarding and peer monitoring — keys generated for you (native sodium), IPs allocated automatically, existing peers adopted. MikroTik, Docker & Linux targets.
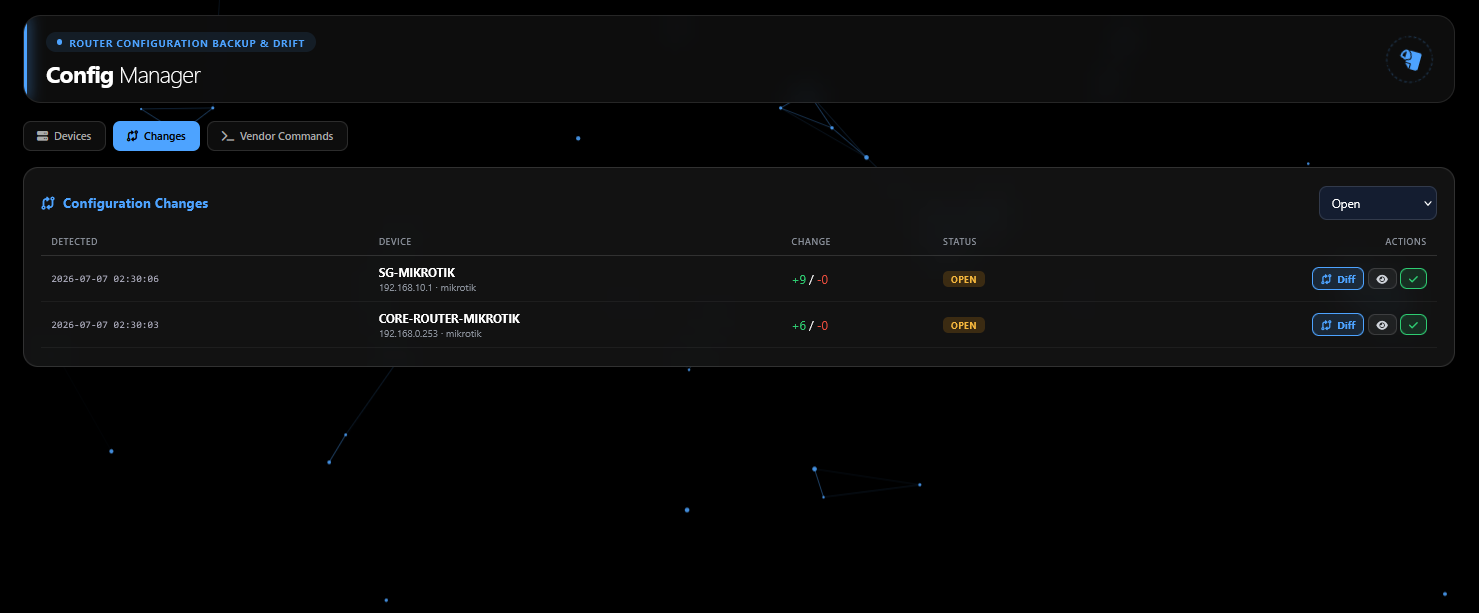
Config Manager
NCM-style backups: fetch, version and diff your router configs over SSH — with drift alerts the moment something changes off-book.
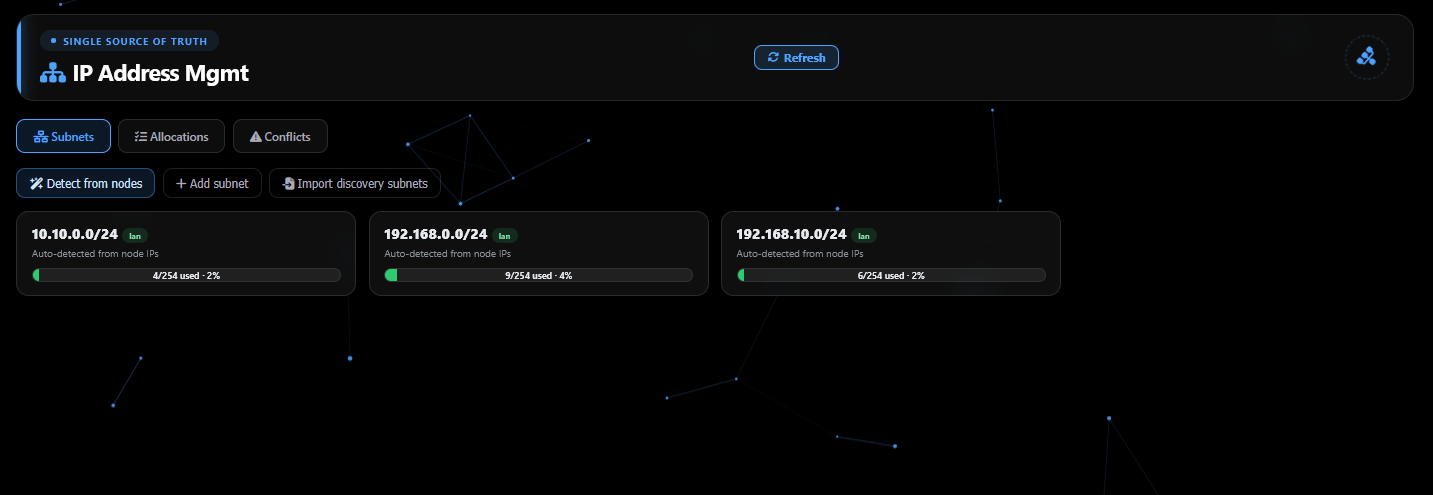
IPAM
A single source of truth for your IP space — utilization bars, next-free suggestions, conflict detection.
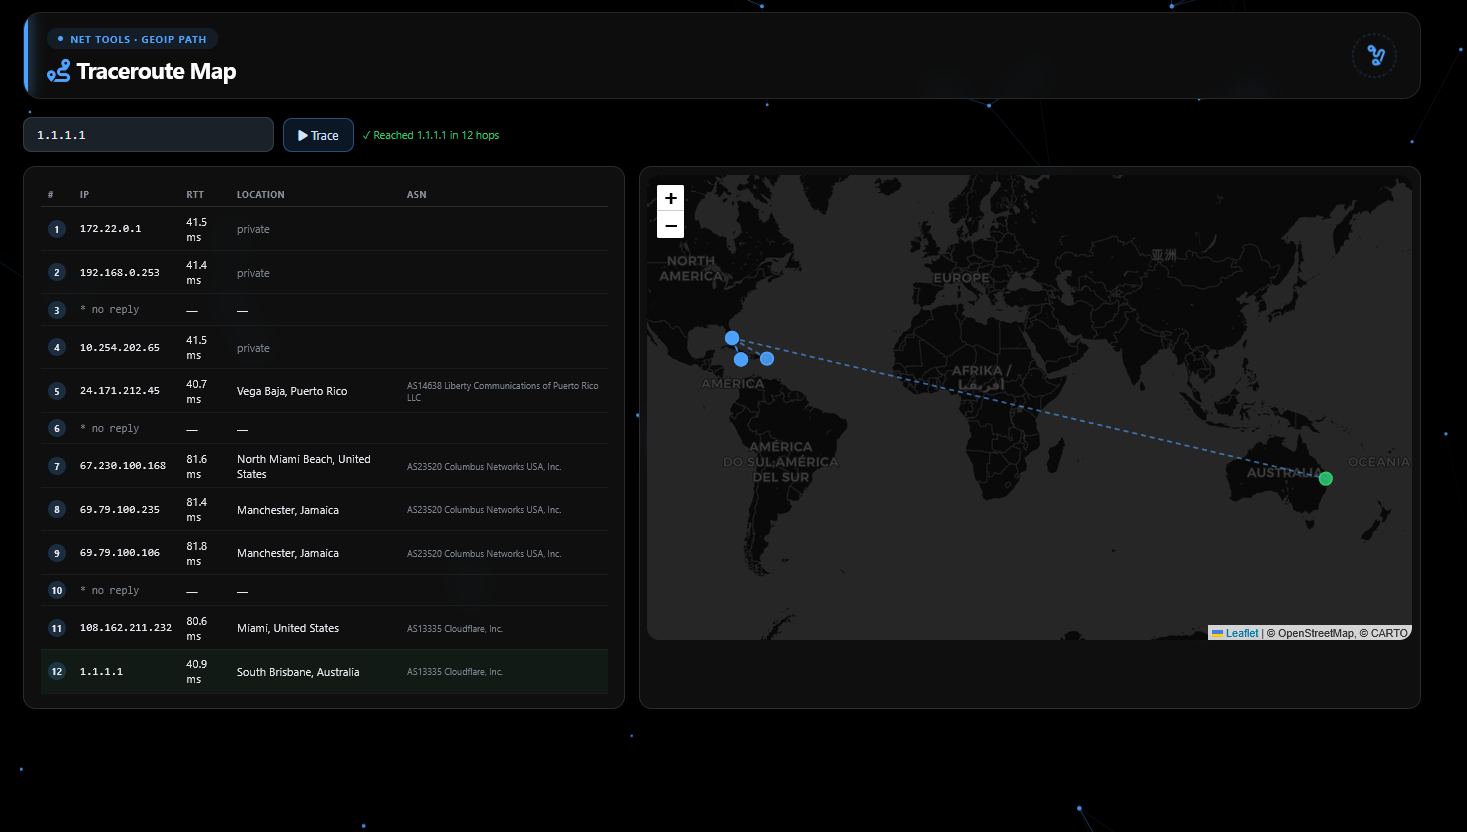
Net Tools Suite
Live Ping, Traceroute-on-a-world-map, Netstat graph, NS Lookup and a built-in Port Scanner (WebGL sonar) — the essentials, beautifully done, zero extra installs.
Scale across sites
One site or a hundred. Run headquarters and every branch as a single, governed pane of glass.
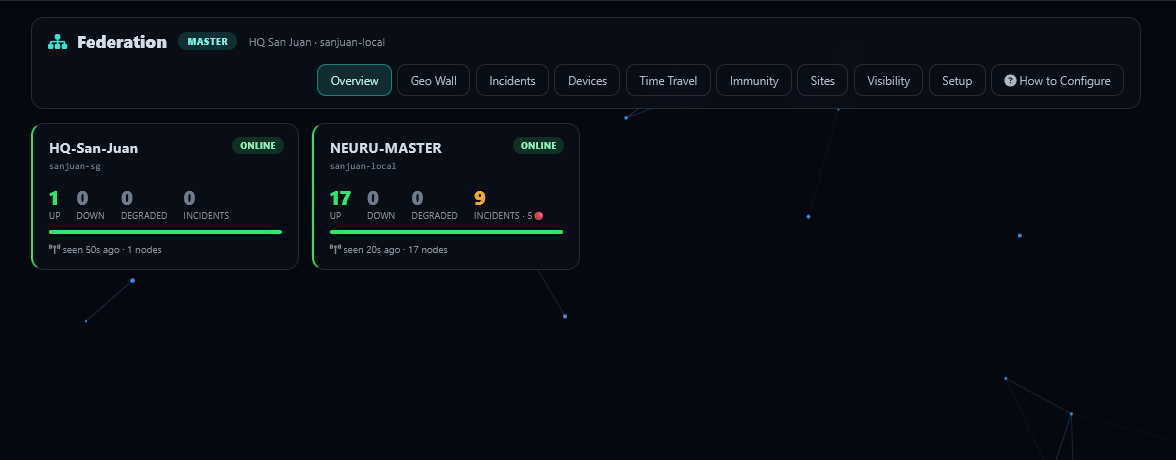
Federation
Run HQ + remote sites as one cluster — each site rolls up to a master, offline-tolerant, no fragile always-on links.
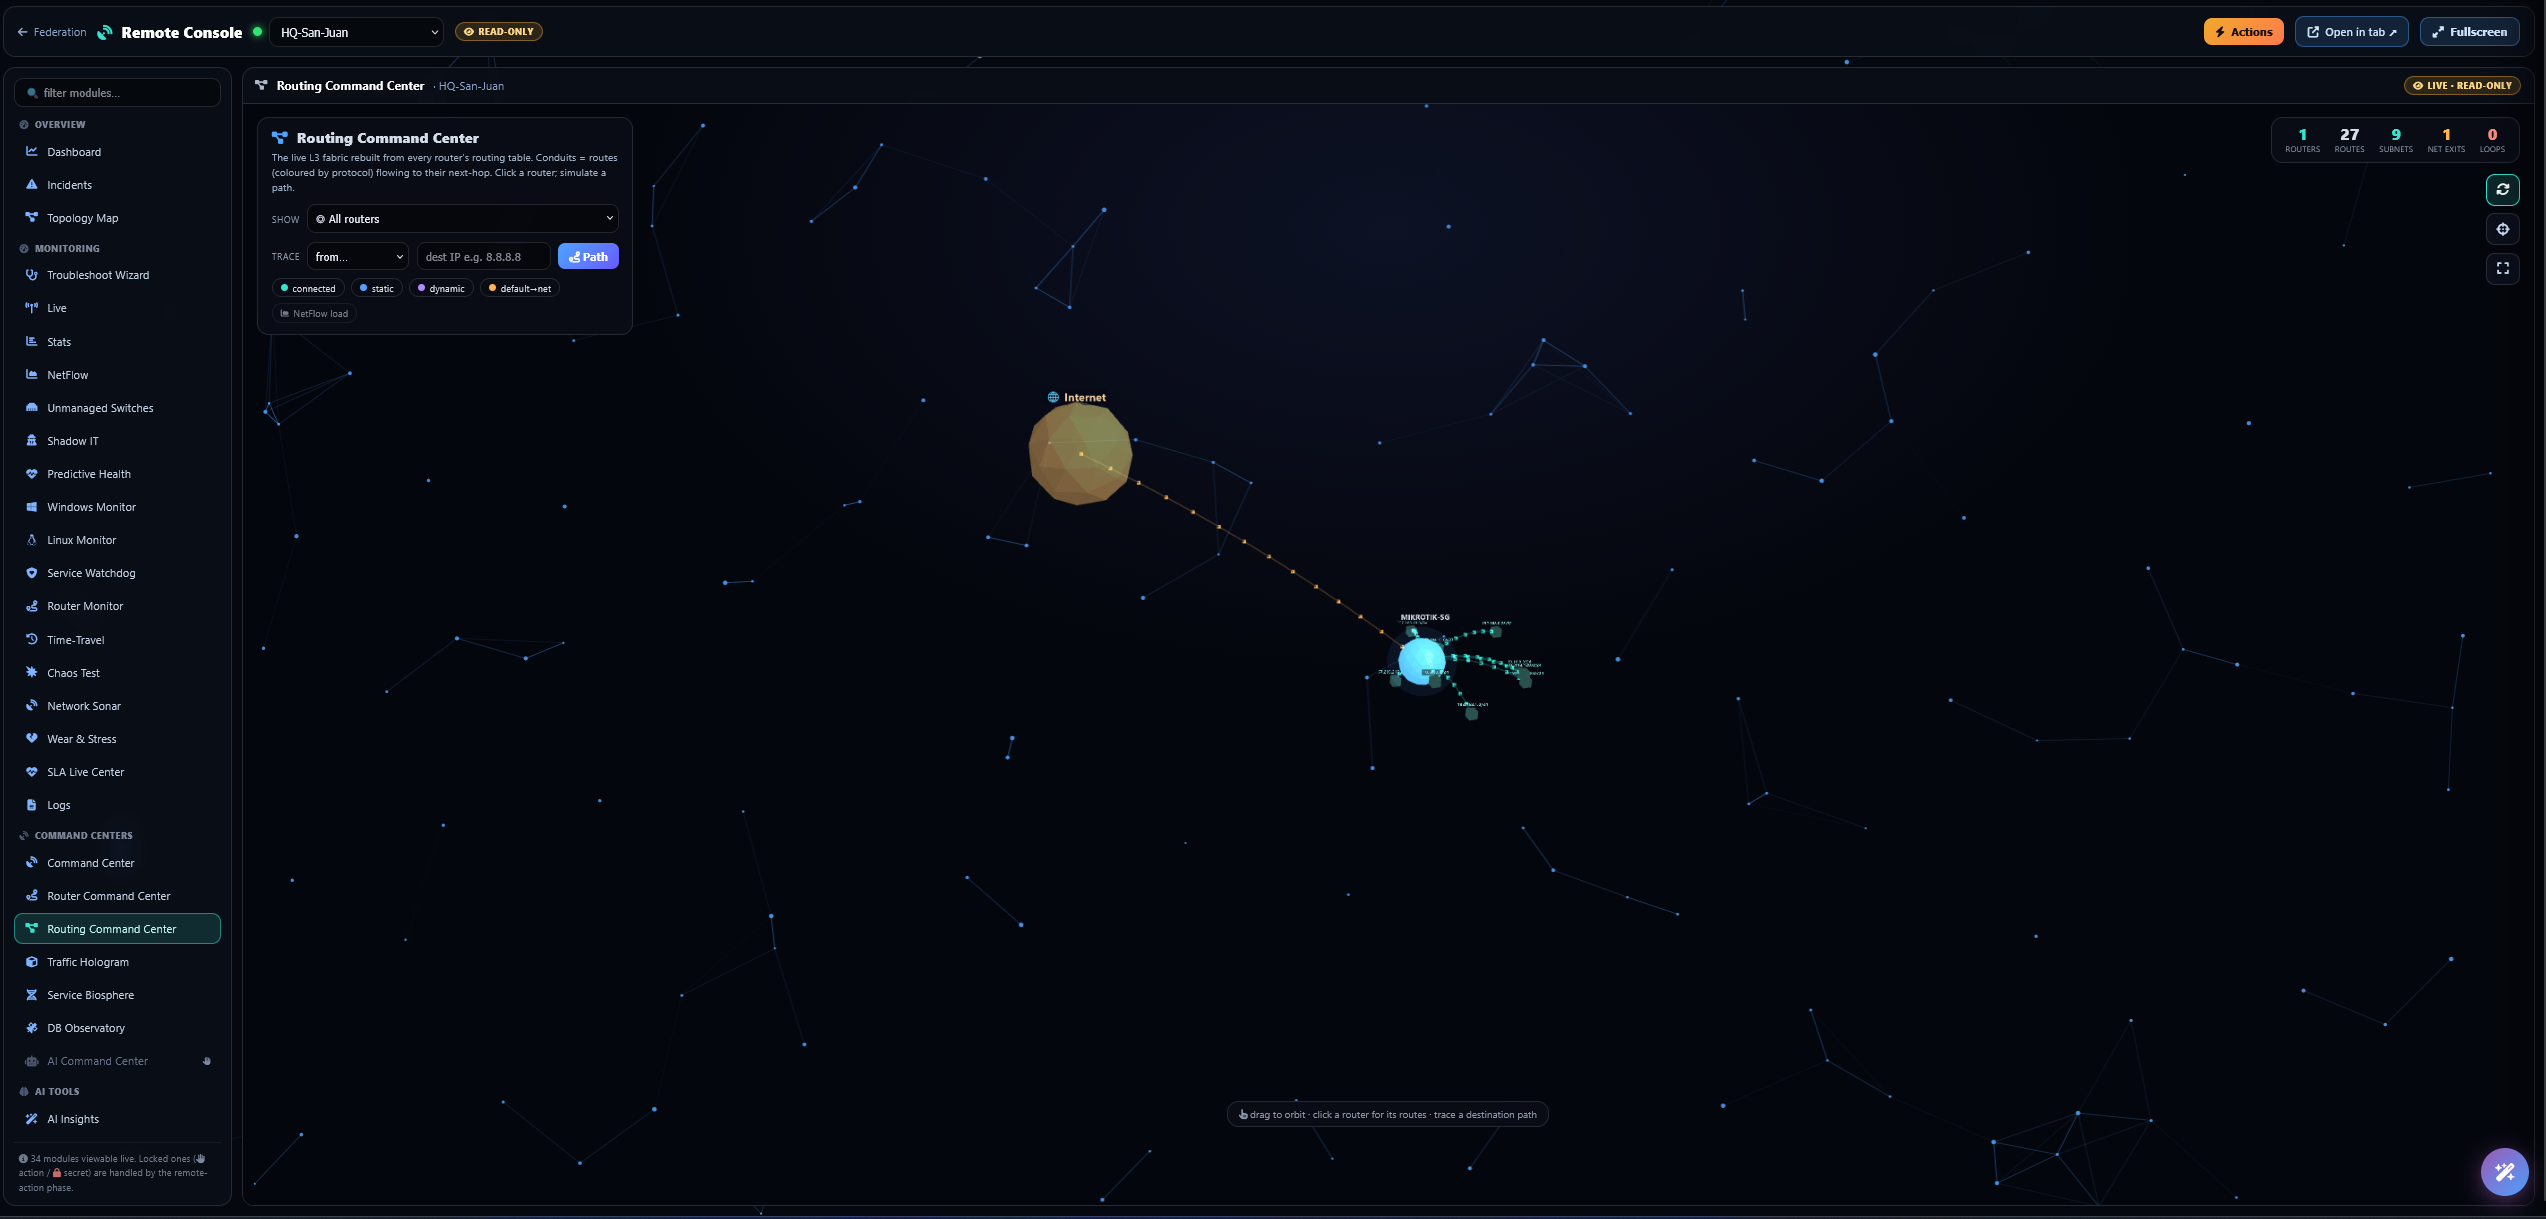
Remote Console
Drive a remote site’s entire menu from the master over a secure SSO view — read-only, or with audited remote actions.
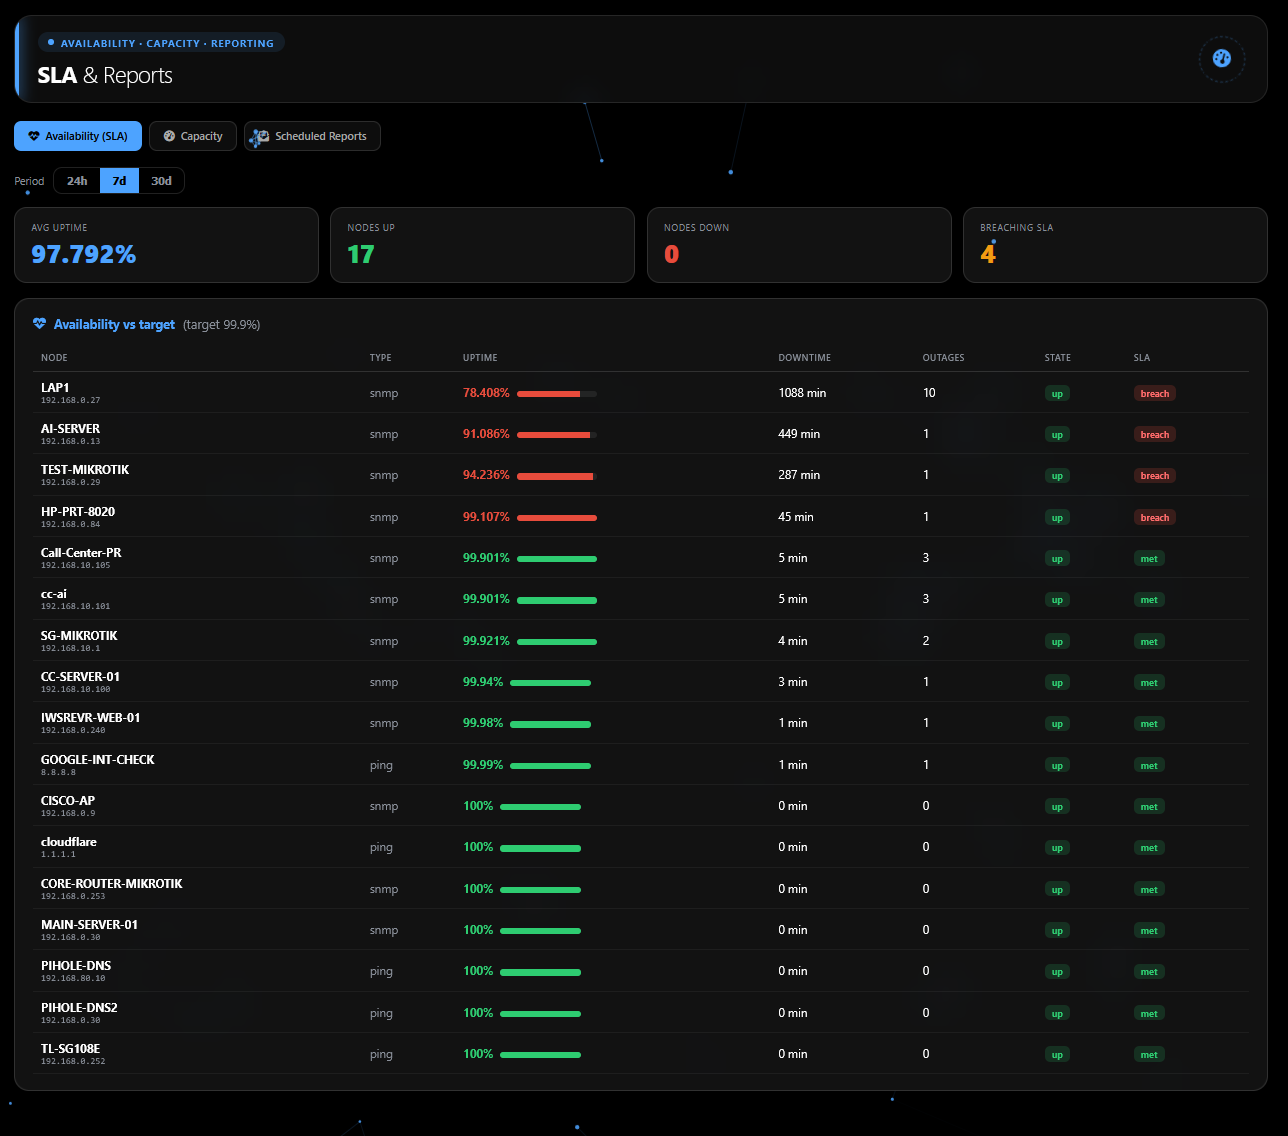
SLA & Reports
Board-ready availability and performance reporting — the numbers your customers and management ask for.
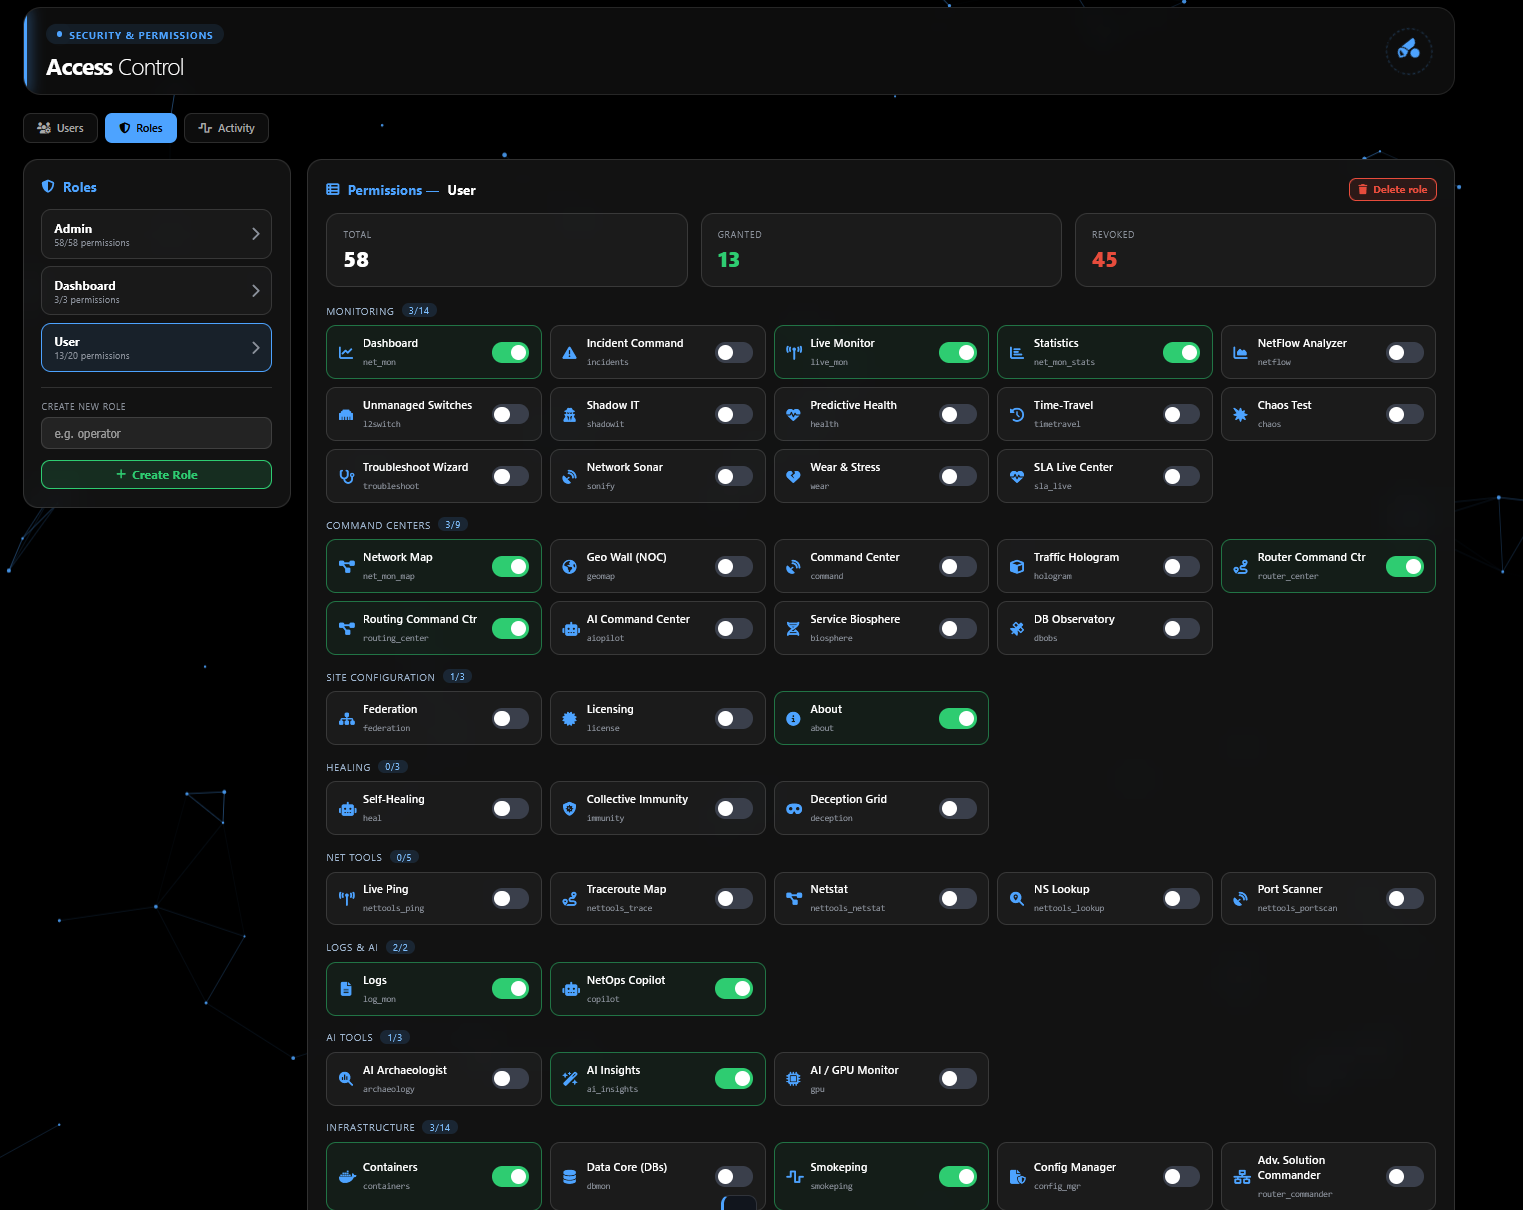
Access Control
Layered RBAC — per-role and per-user, deny-wins, lockout-proof. Perfect for MSPs and teams.
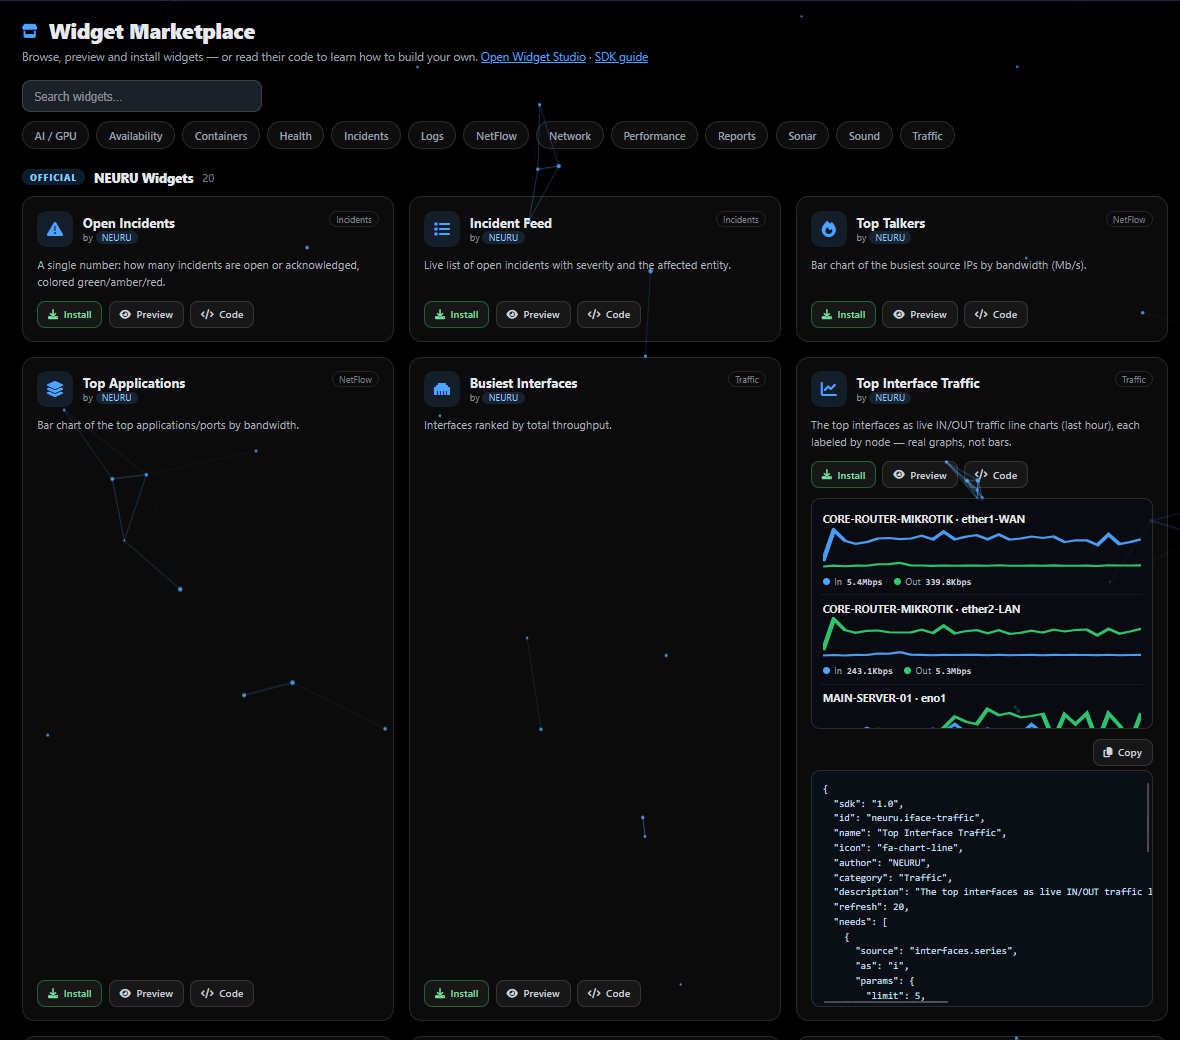
Widget Studio & Marketplace
Build, import and share your own dashboard widgets — a no-code studio, an SDK, and a marketplace to grow.
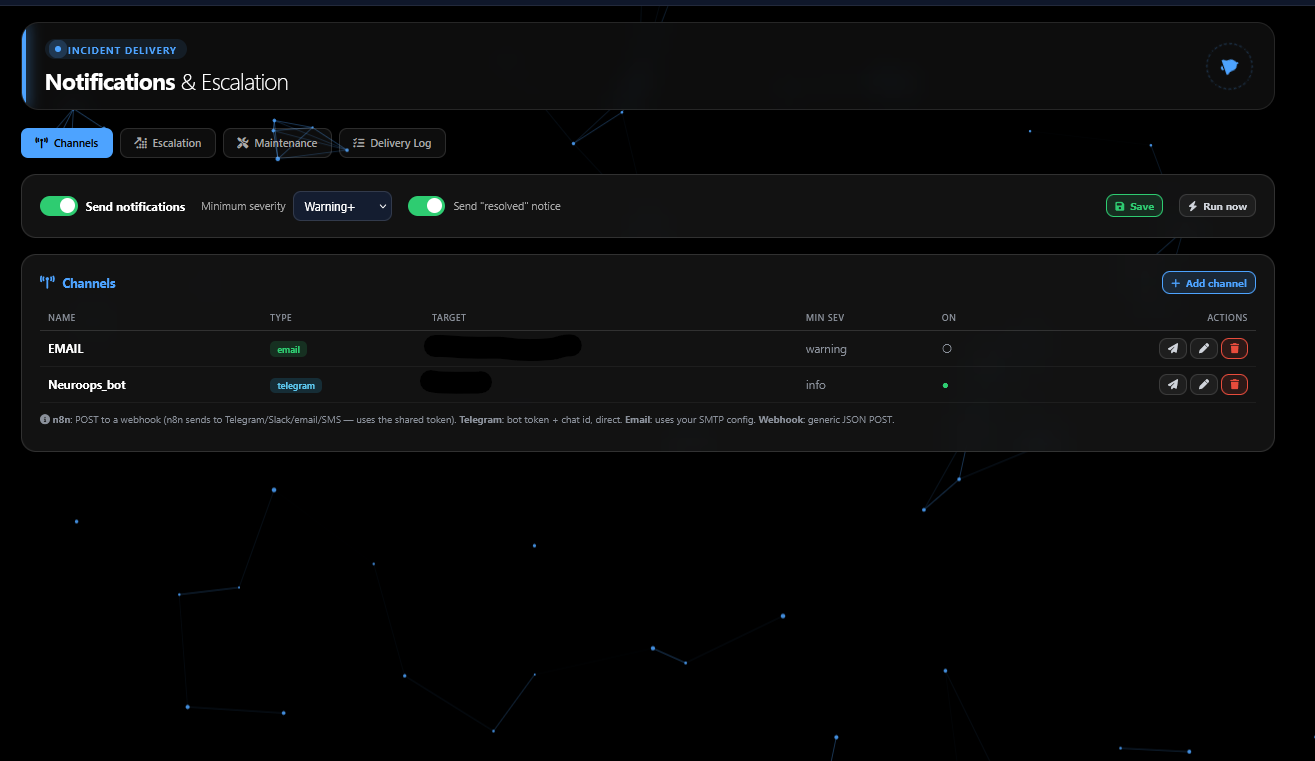
Notifications & Maintenance
Central alerting with site-wide maintenance windows, so planned work never pages the whole team.
Connect your stack
Already running great open-source tools? NEURU brings them into one pane — and adds its own where you have none.
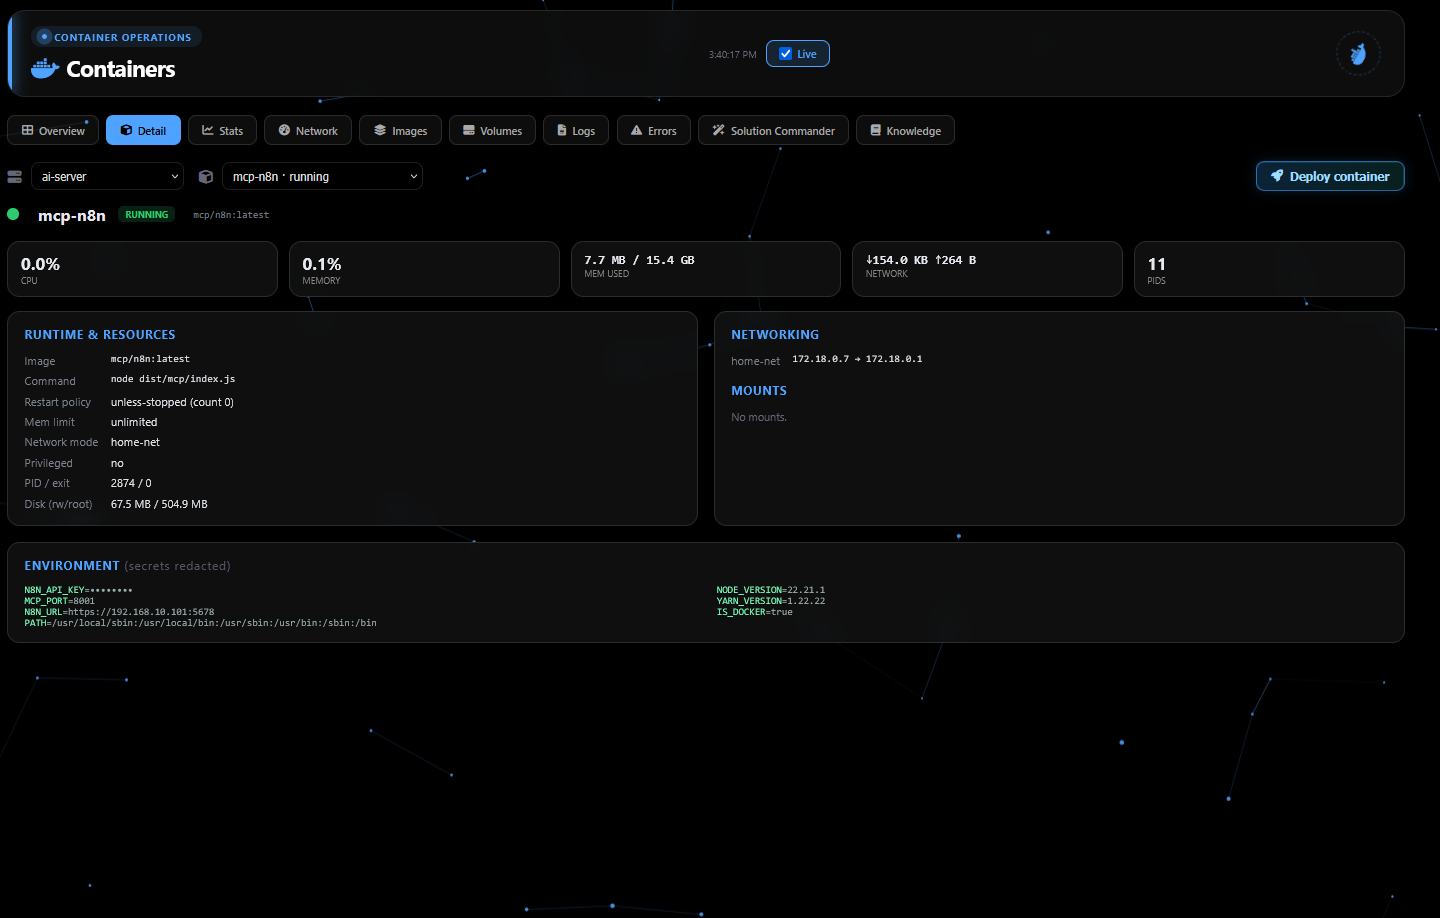
Containers
A Portainer-powered container console with an AI incident desk built in.
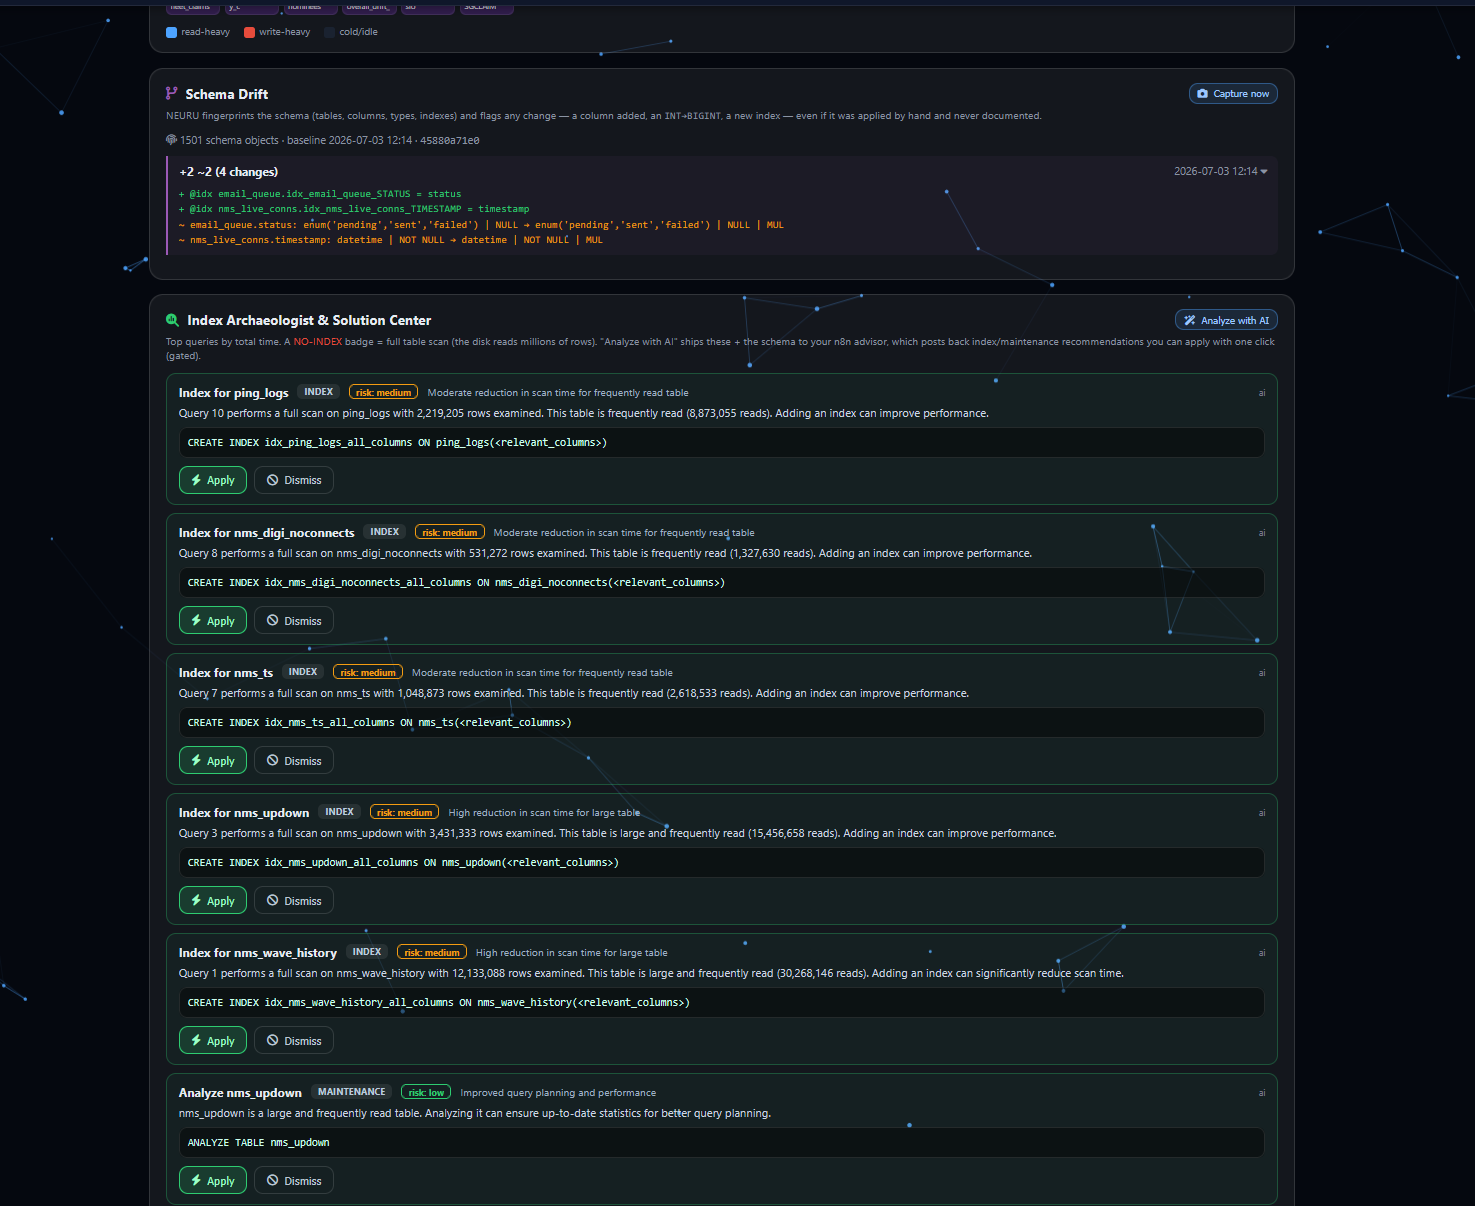
Data Core
Agnostic database monitoring (MySQL / Postgres) tied to your nodes — deadlocks, pools, query heat.
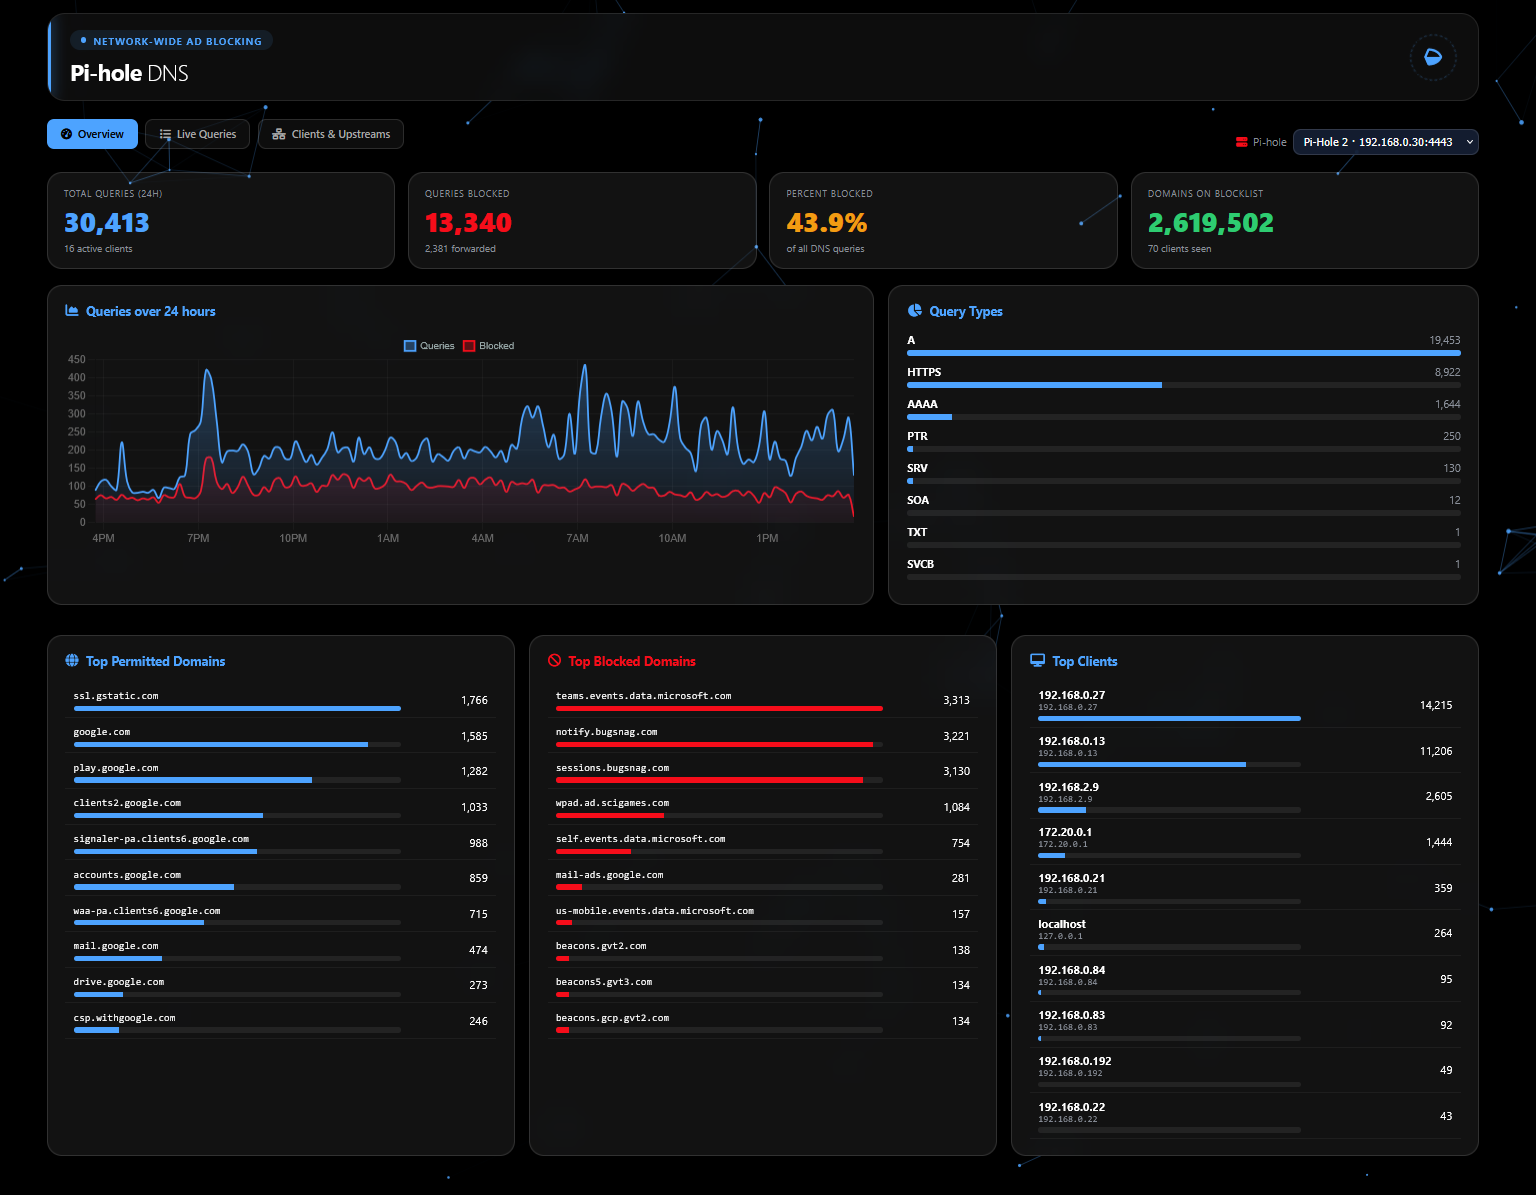
Pi-hole
Live DNS stats, top lists and query log across every Pi-hole you run — and one-click fleet-wide domain blocks.
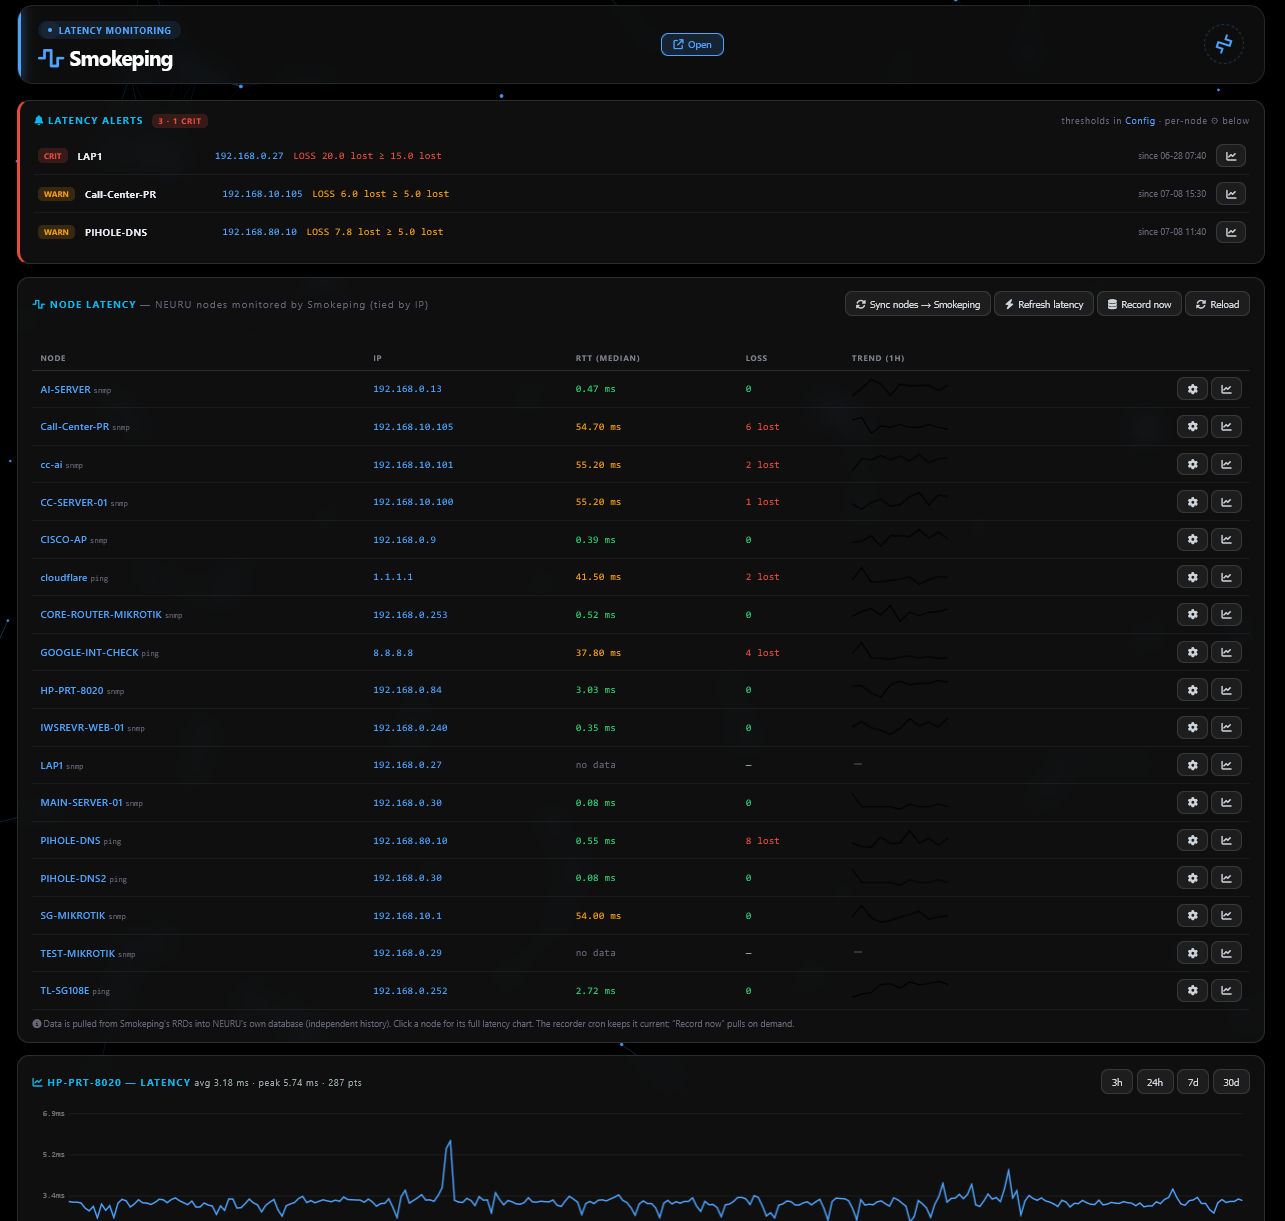
Smokeping
Your latency graphs embedded right inside NEURU, with remote target management.
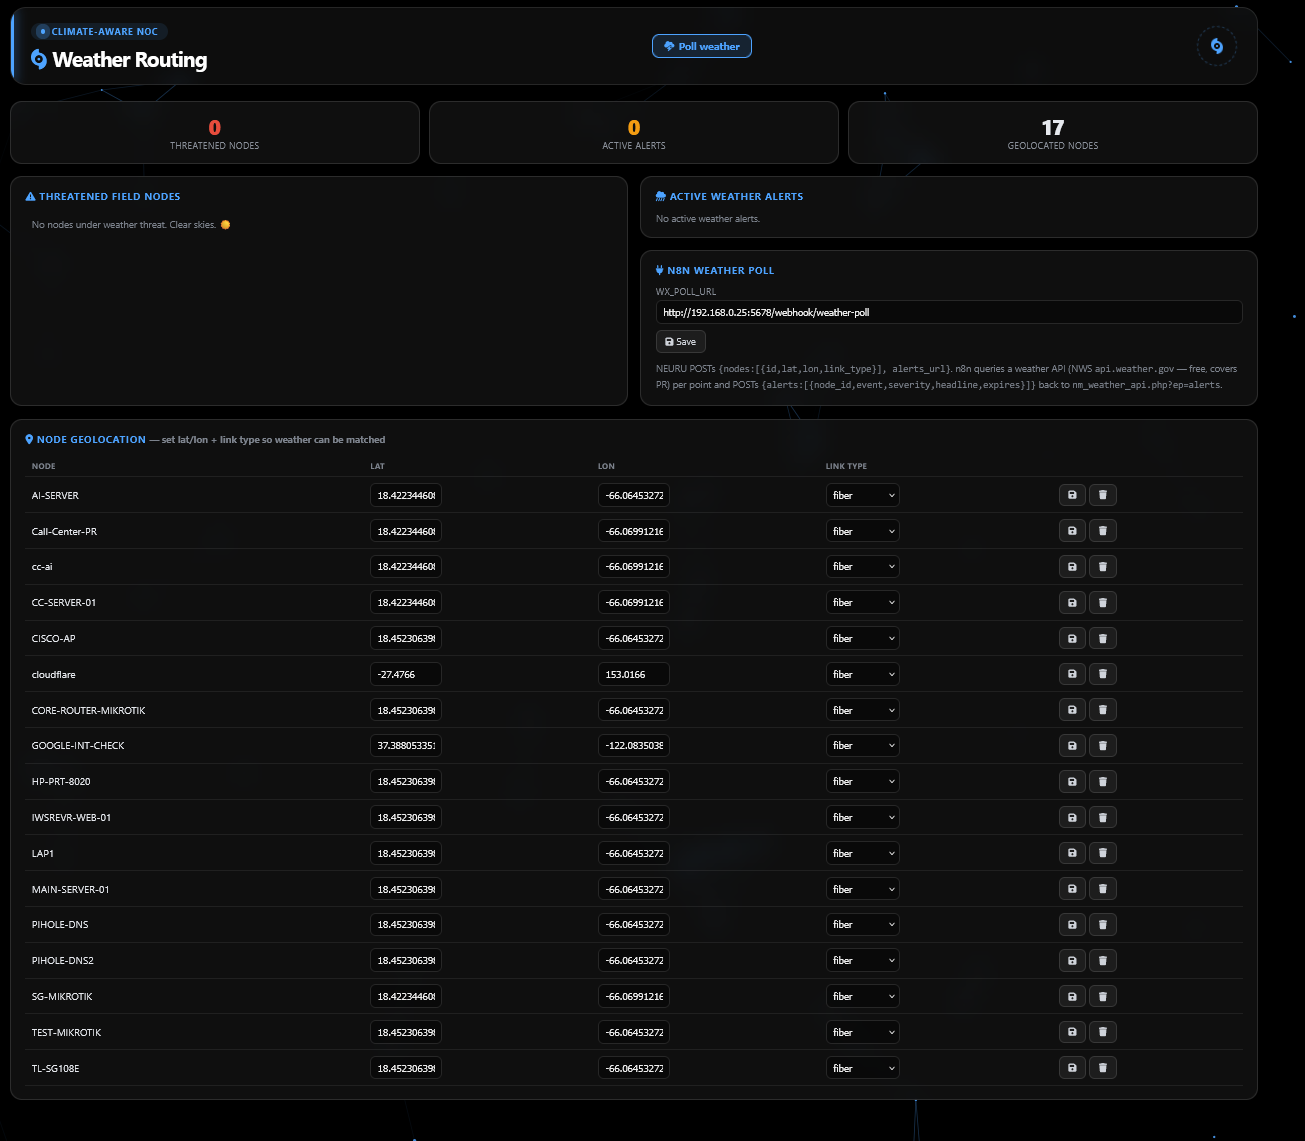
Weather Routing
Overlay real weather on your paths — because sometimes the outage is a storm, not a switch.
Gamers Hub
NEURU isn’t just for the NOC. It reads your gaming rig over SSH: a one-time setup enables OpenSSH Server and installs LibreHardwareMonitor (CPU/GPU/fan sensors) + SNMP — one script does all three — then it becomes a real-time performance cockpit, a lag detective and a one-click optimizer. Same engine as the enterprise monitor, aimed at your framerate.
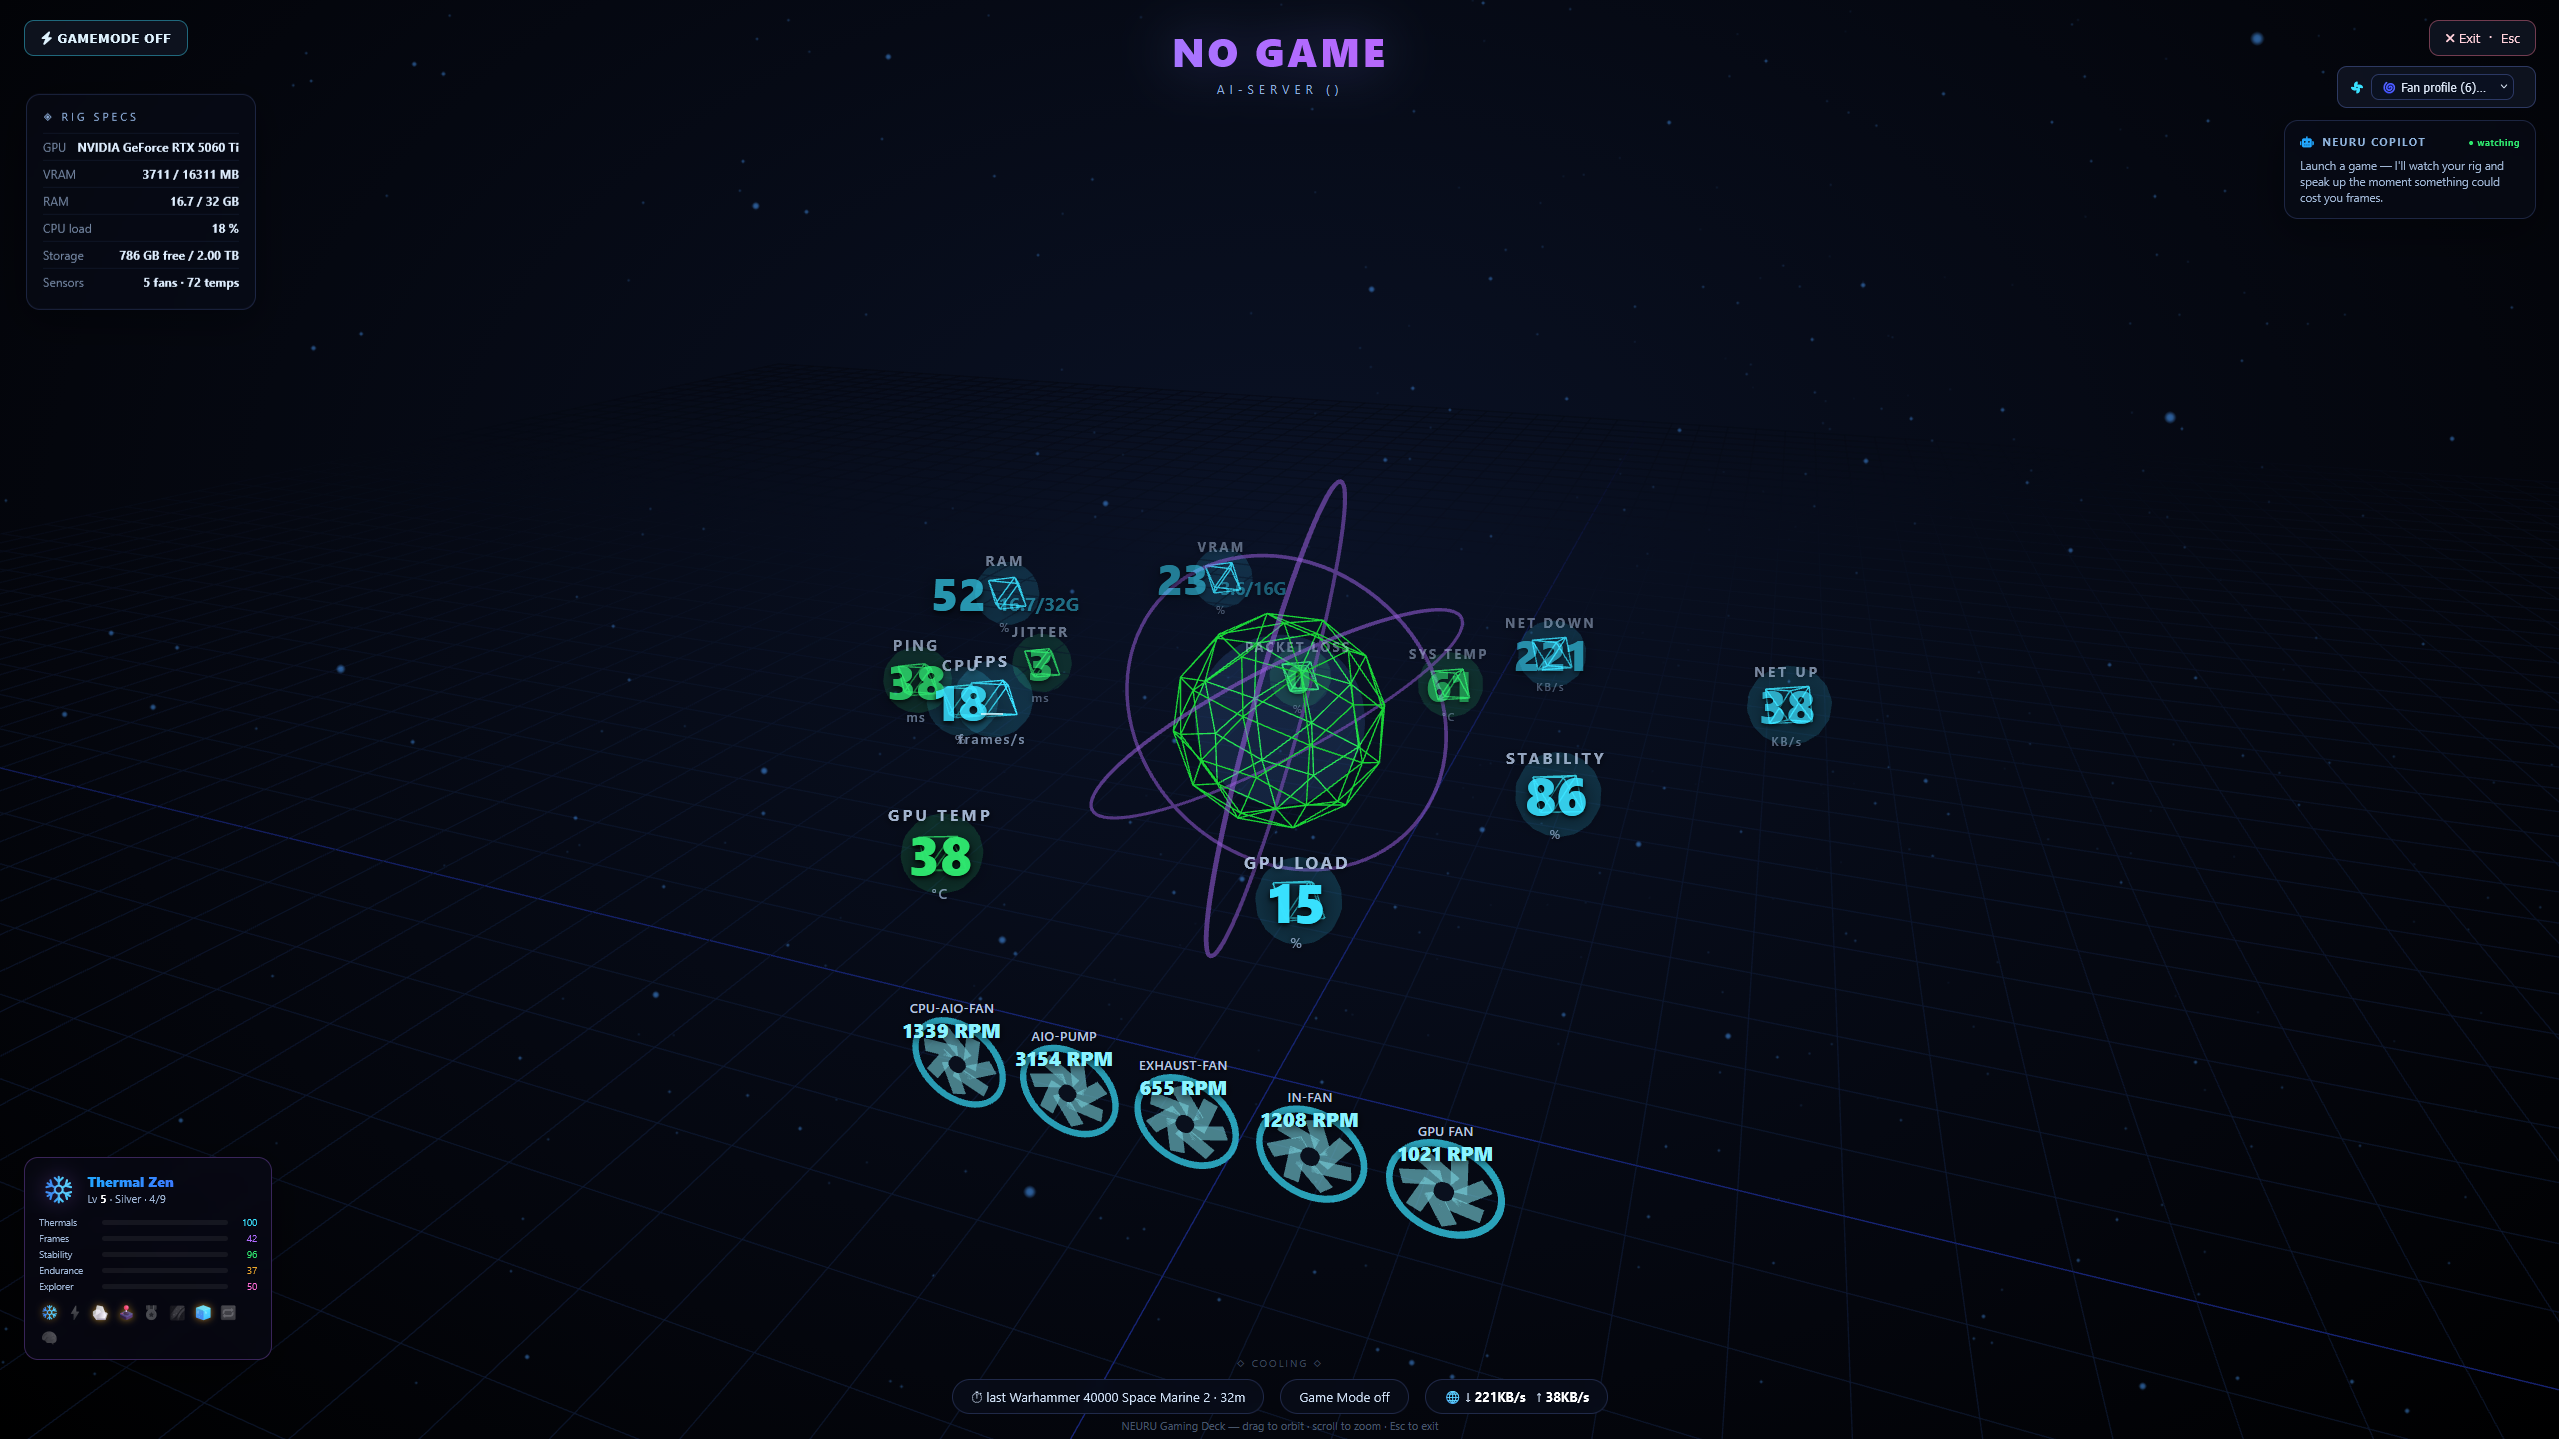
Gaming Deck
A fullscreen 3D rig cockpit: live GPU/CPU/RAM load, temps, VRAM and thermal-throttle read agentlessly over SSH, with auto game-detection (15+ known titles — plus any Steam / Epic / Xbox / EA / Ubisoft title generically) and a ping-radar that measures latency + jitter to each game-server region. 15 game-reactive HUD skins.
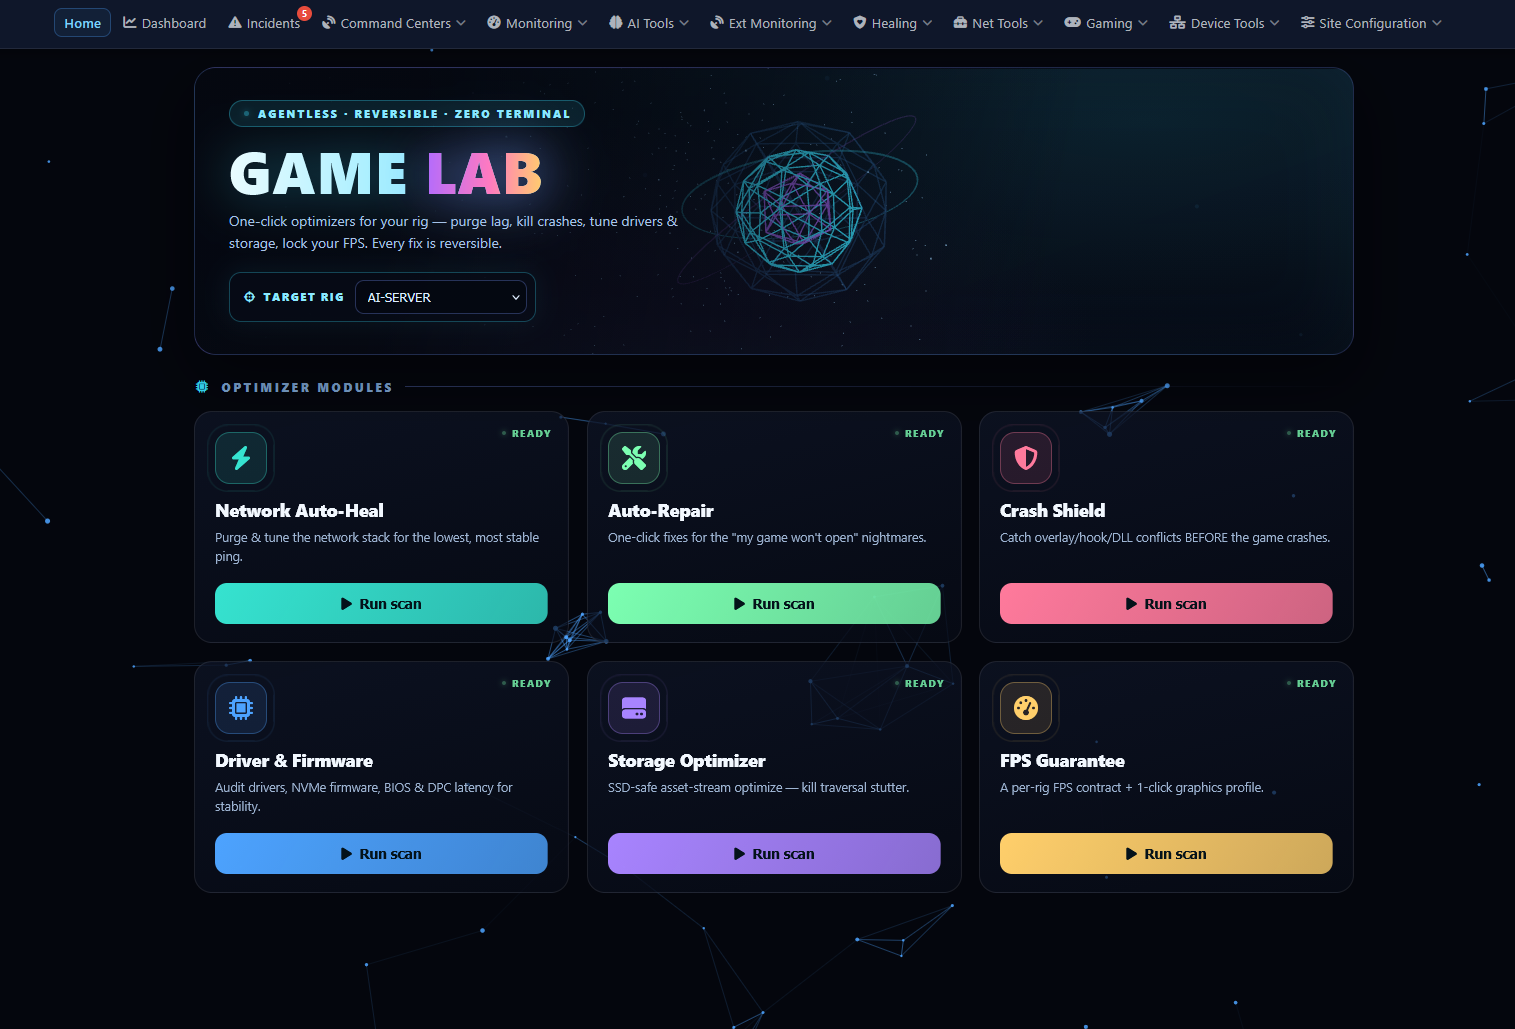
Game Lab
One-click, reversible optimizers over SSH: flush DNS/Winsock + set a fast gaming resolver, repair Gaming Services & launcher caches, a crash-shield for overlay/anti-cheat conflicts, a driver/firmware advisor, SSD-safe trim & shader-cache purge, and a per-rig FPS target. Every fix is audited and undoable.
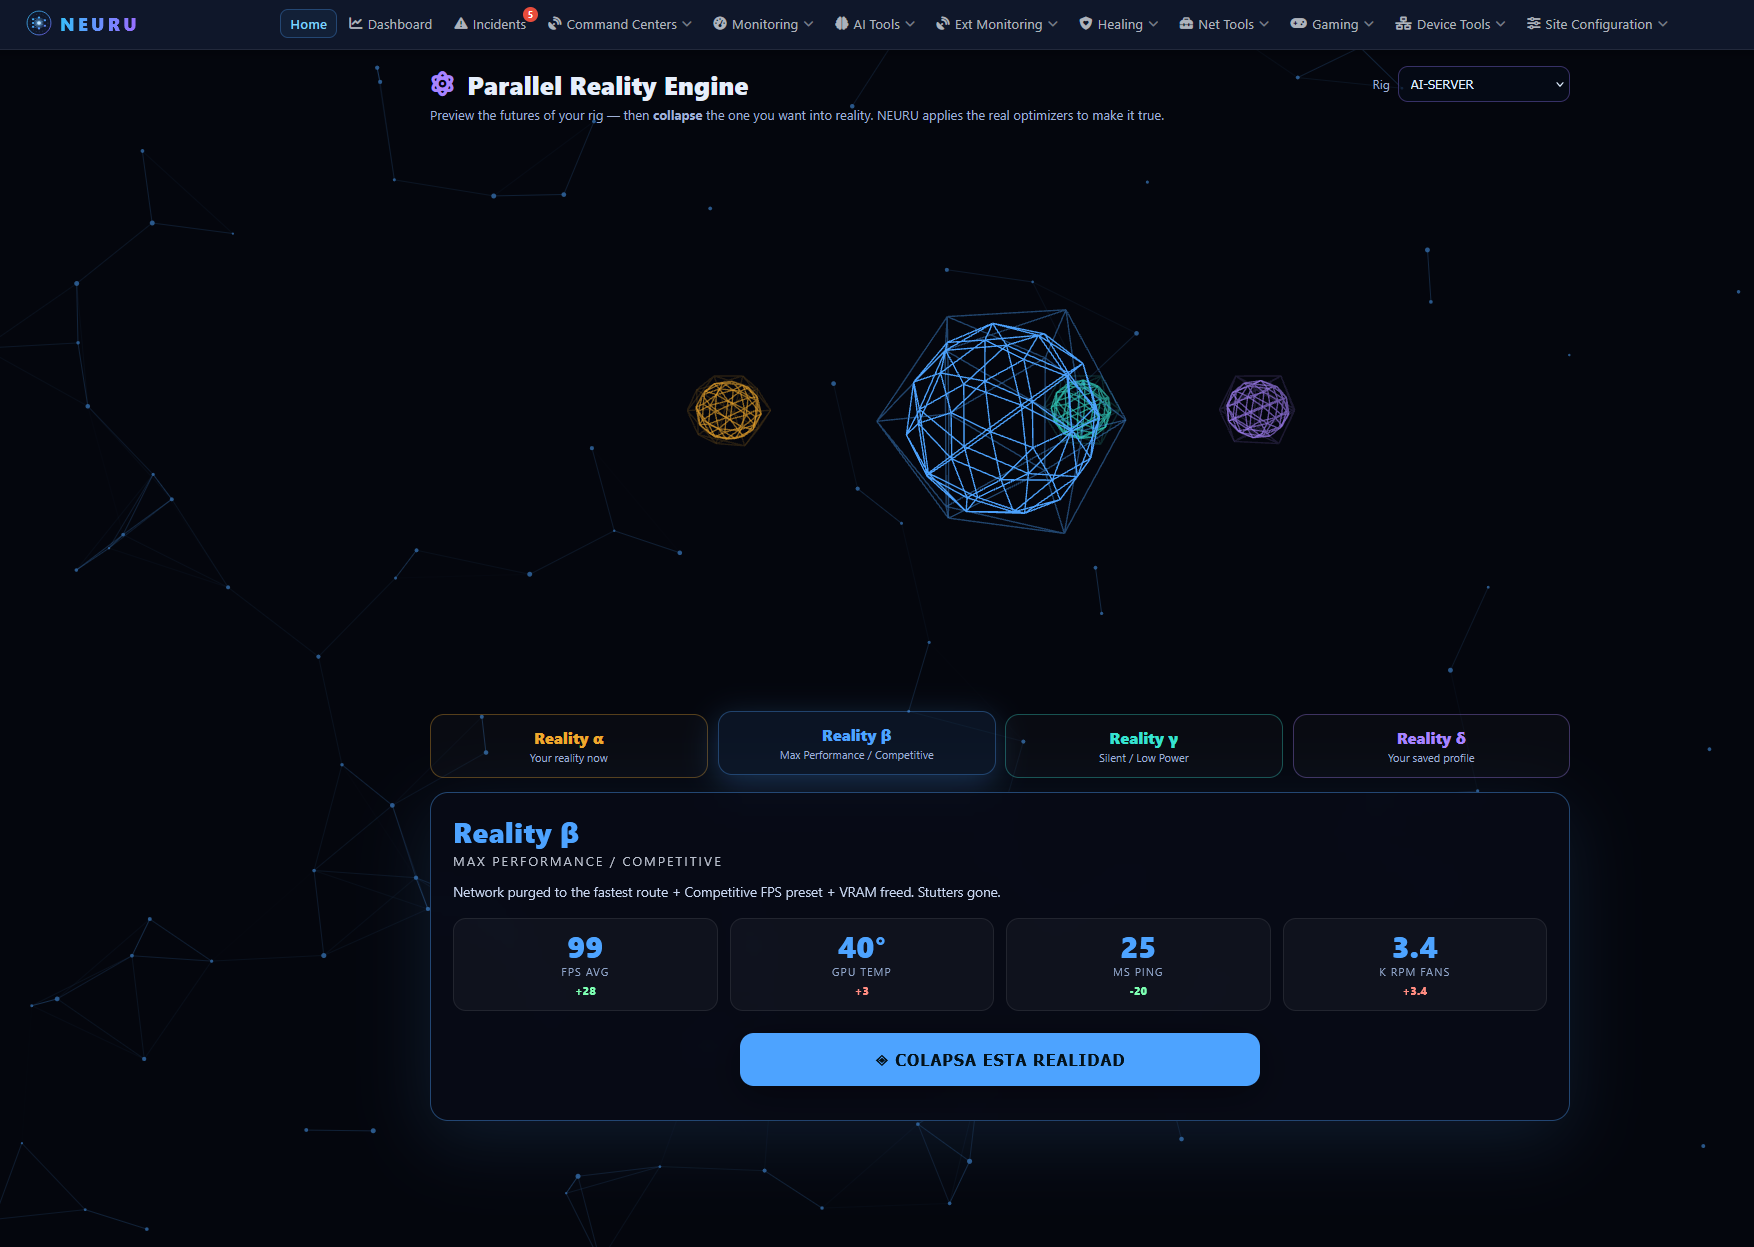
Parallel Reality
The flagship experience — a holographic multiverse of your rig’s possible states. Preview alternate realities (Max-Perf, Quiet & more), compare their projected FPS & thermals, then collapse into the one you want; whatever you pick is applied through Game Lab’s reversible optimizers.
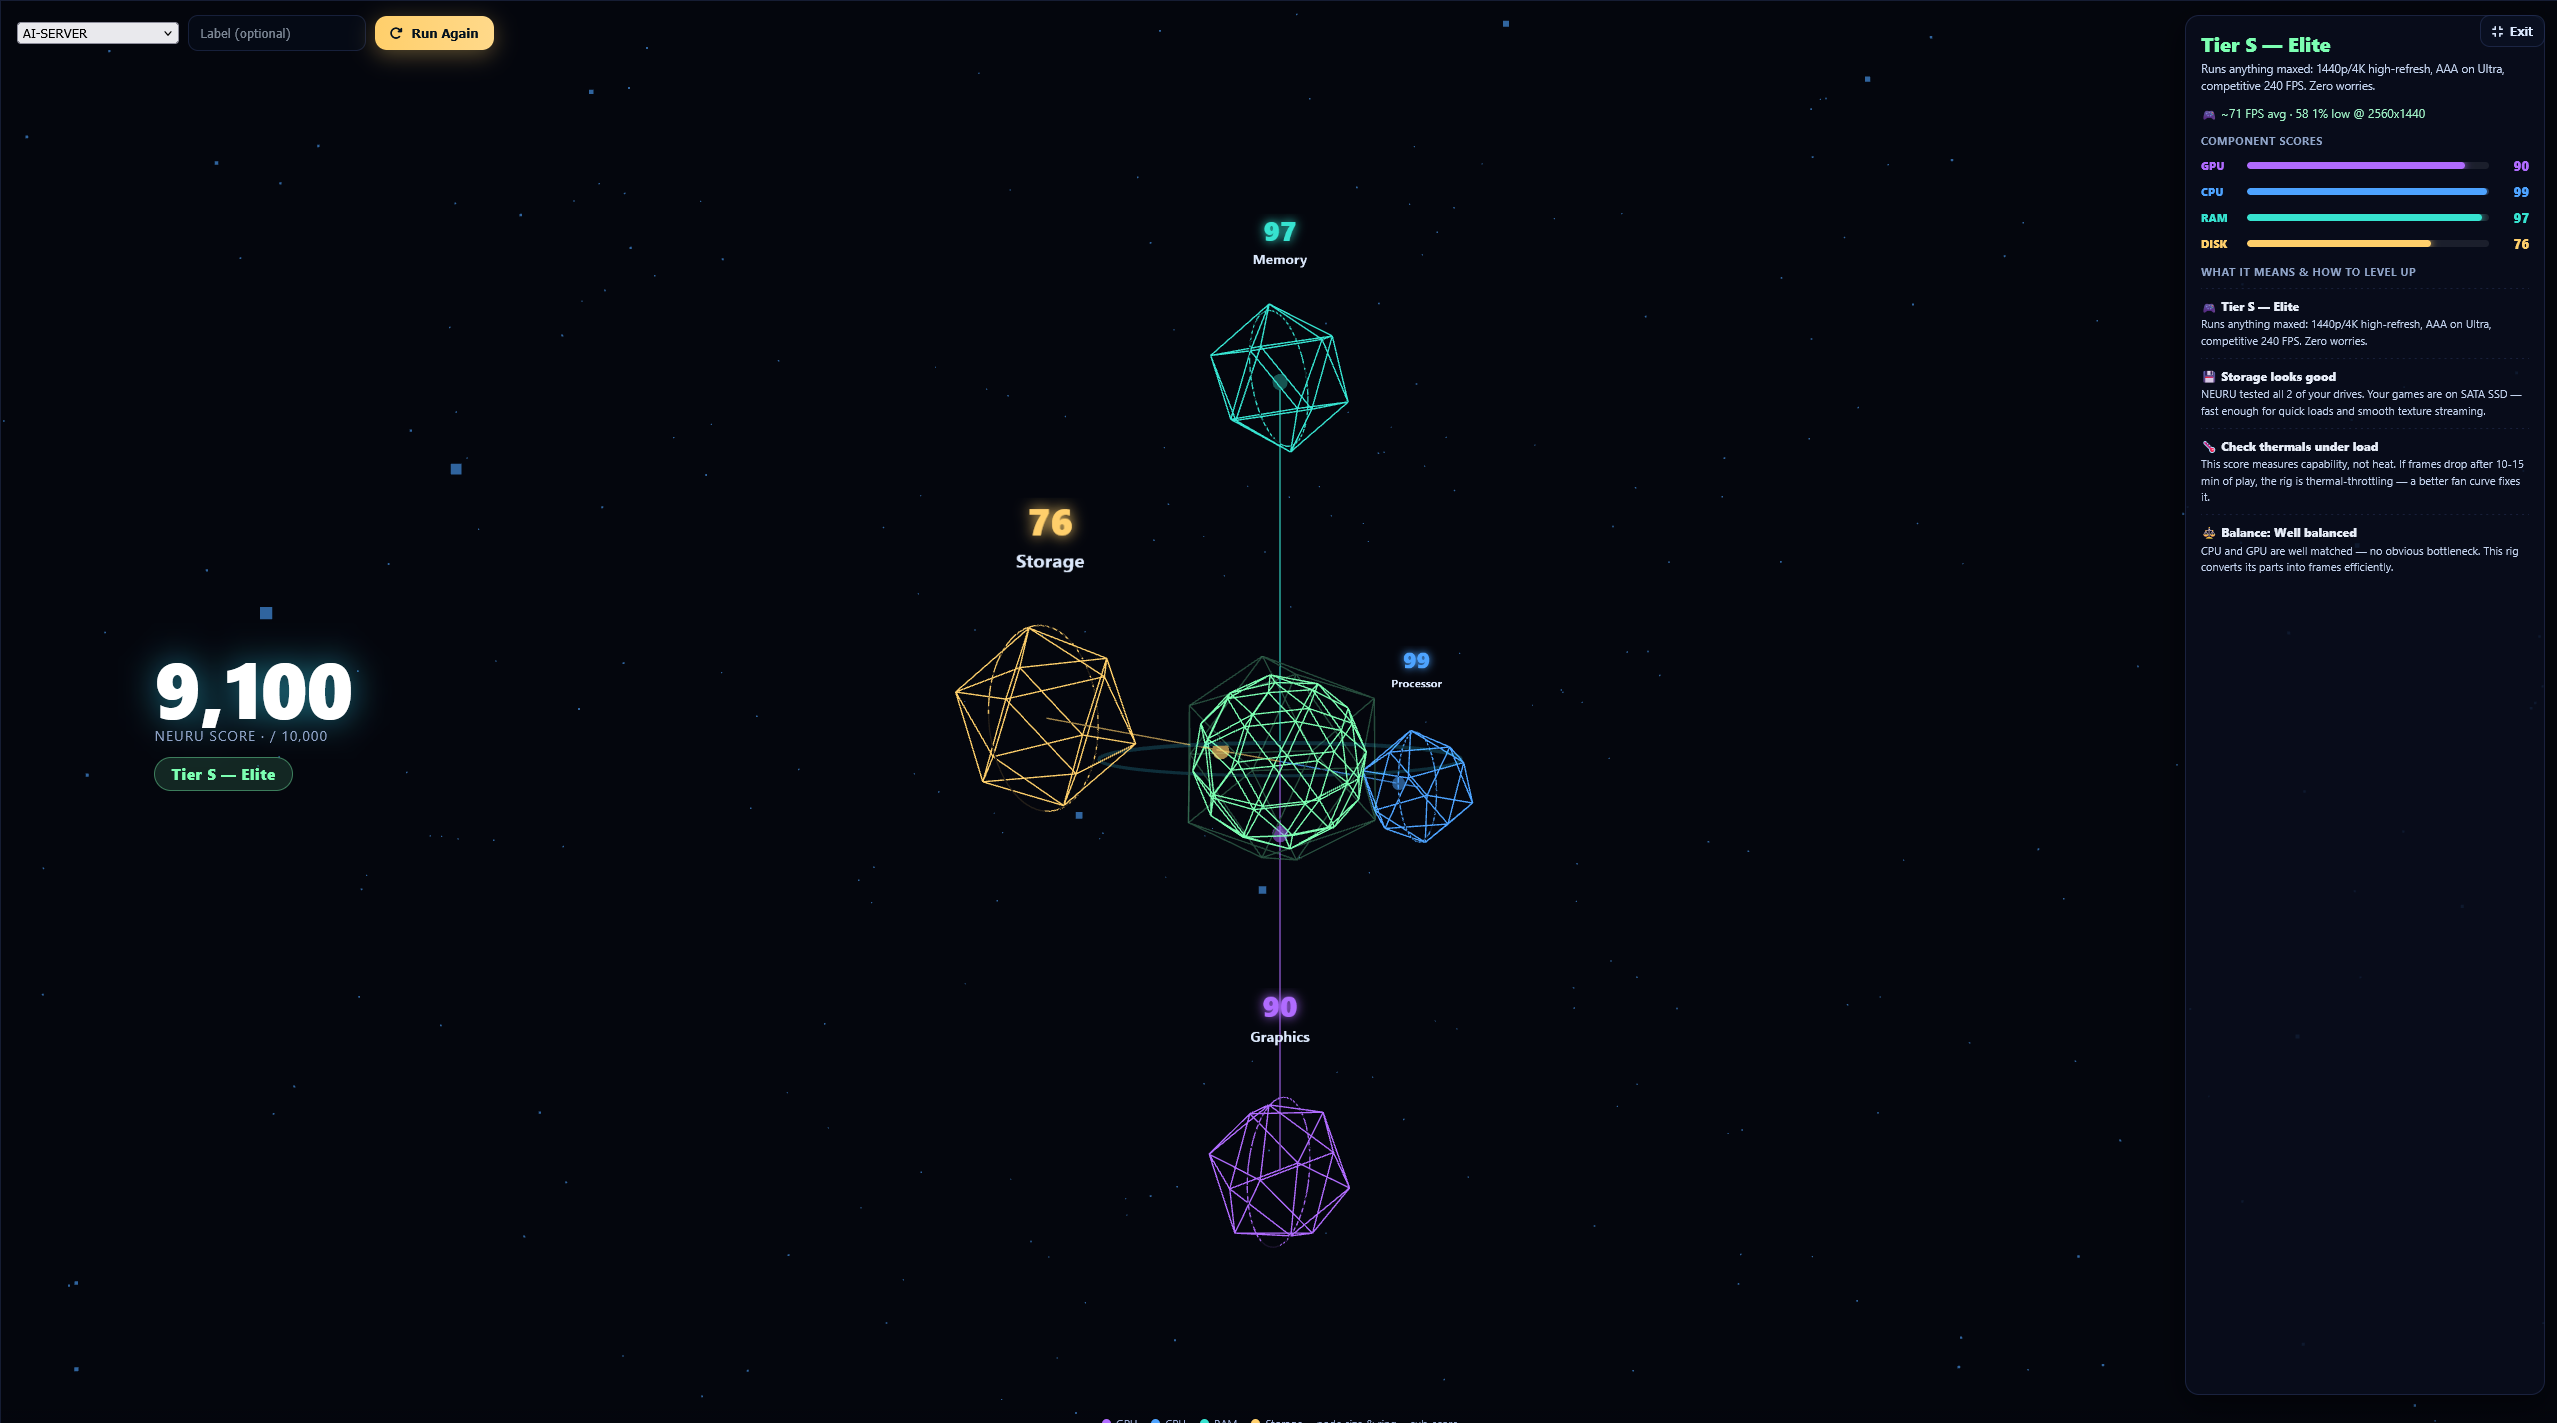
PC Benchmark
“Is this PC actually built for gaming?” — answered with a real NEURU Score (0–10,000) + tier and a plain-English breakdown of every finding. The benchmark runs locally on the rig via PowerShell-over-SSH, and results persist so you can compare runs over time.
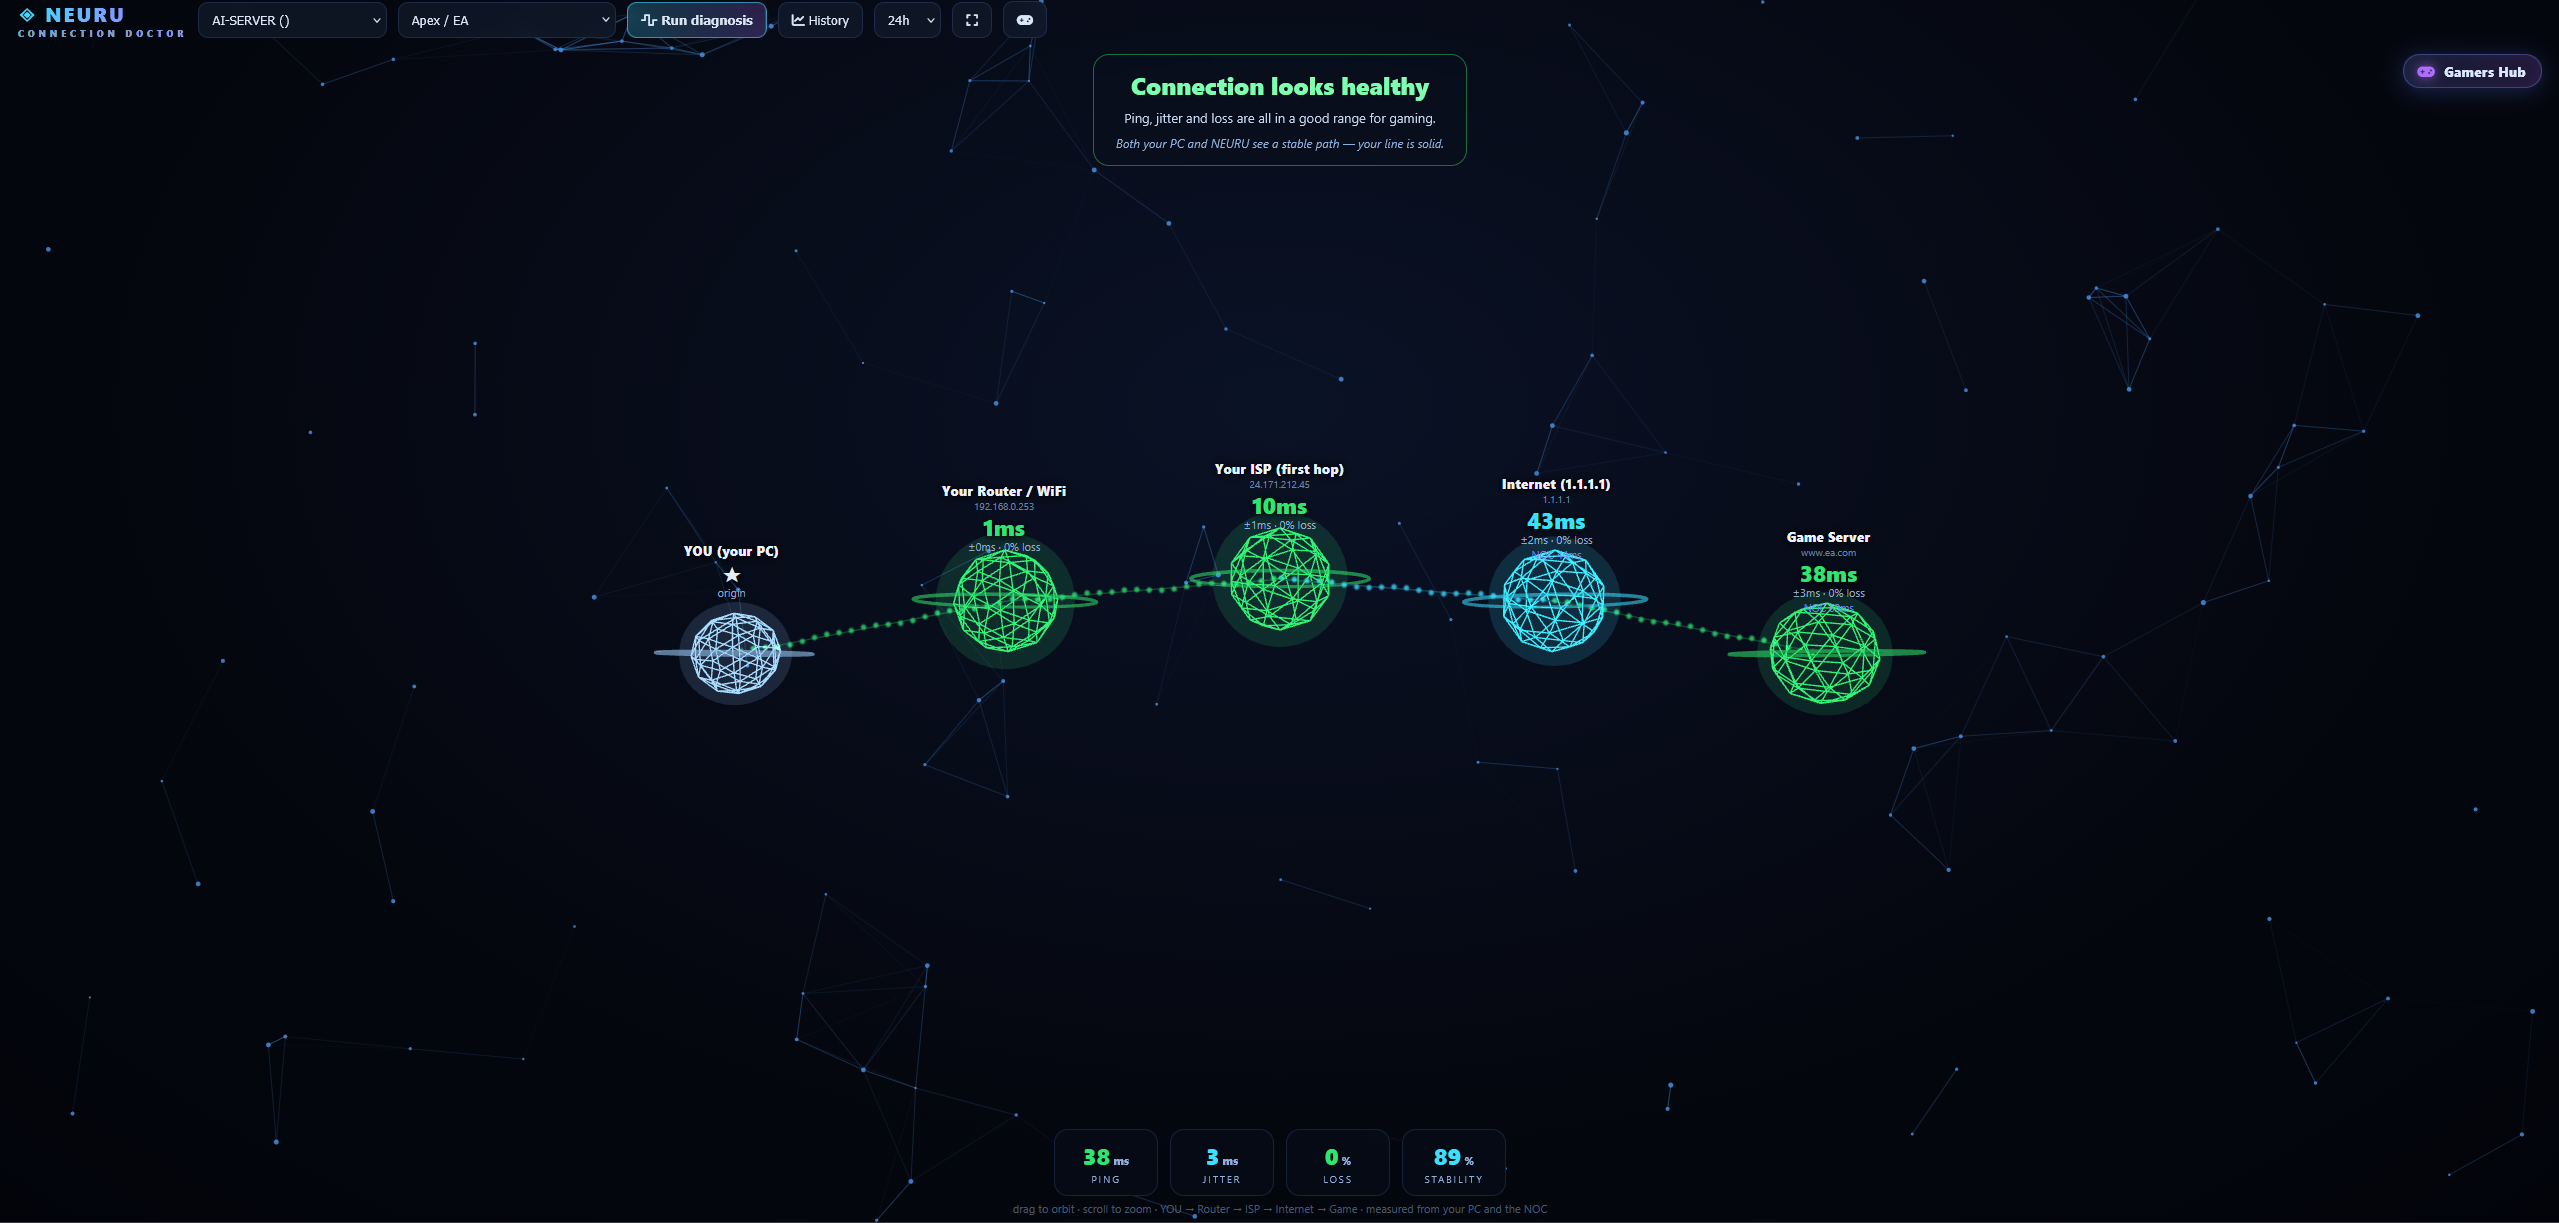
Connection Doctor
The only question that matters mid-match: is the lag my WiFi, my ISP, or the game server? A 3-hop path (PC → router → ISP → game) measured from both your PC and the NOC, with jitter, loss and a 0–100 stability score — plus history so you see exactly when it lagged.
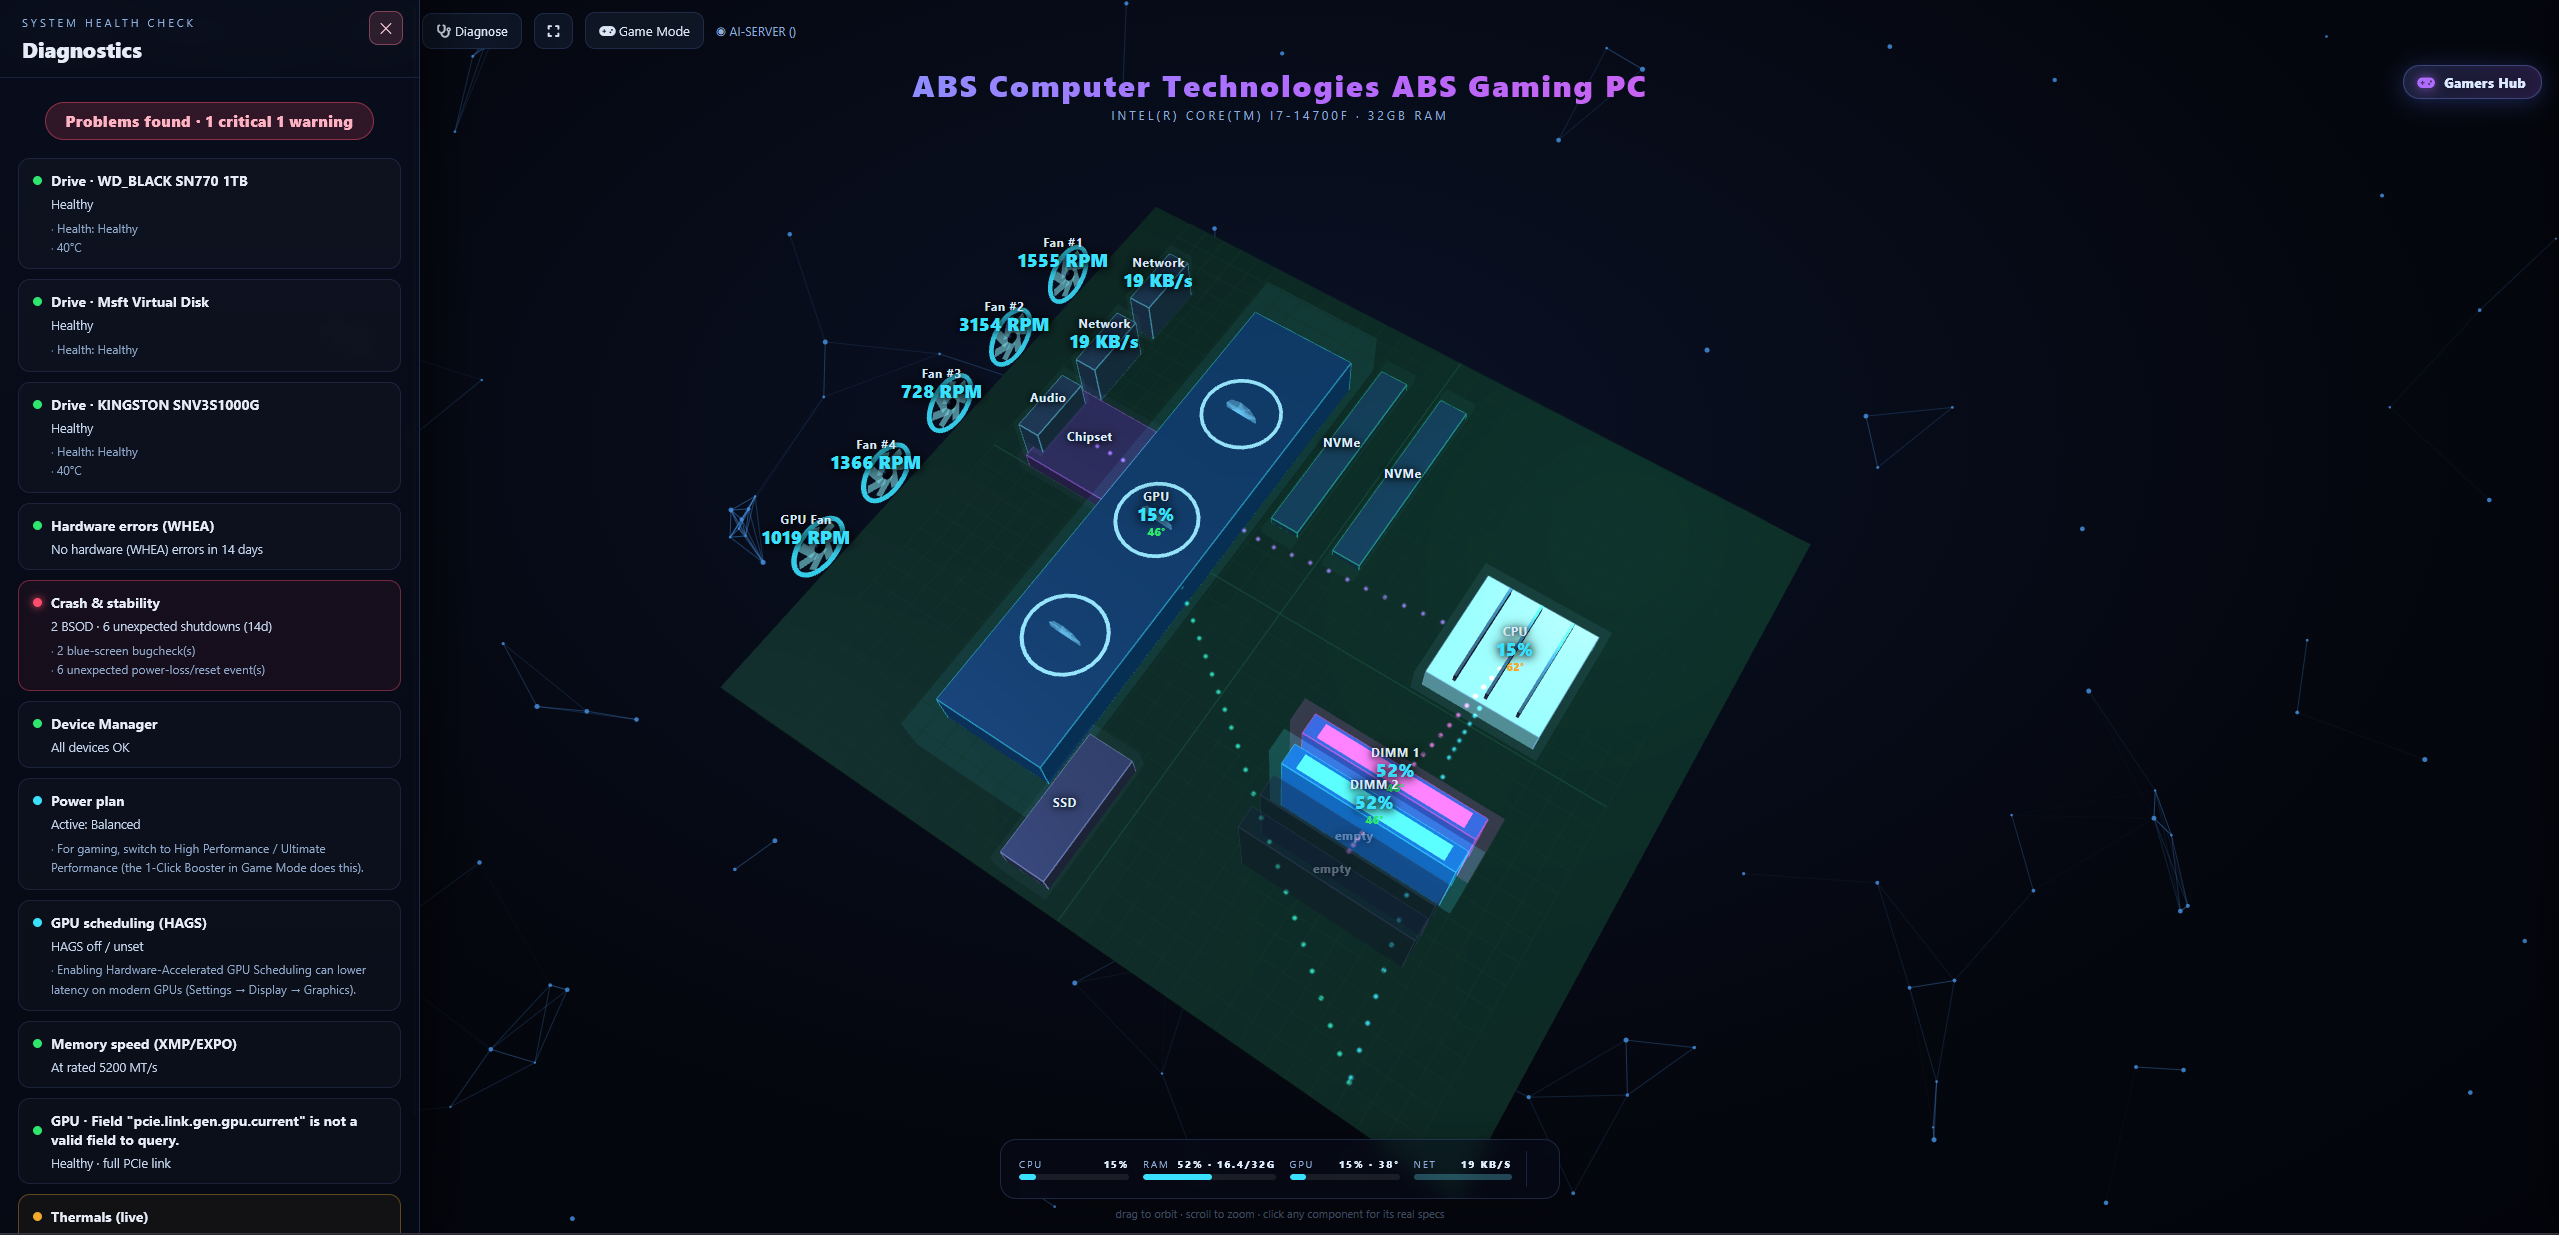
PC Doctor
Your actual PC rebuilt in fullscreen 3D — a real motherboard with clickable CPU, RAM, GPU and NVMe, each detected from your hardware with live temps and one-click links to the vendor’s drivers and spec sheet.
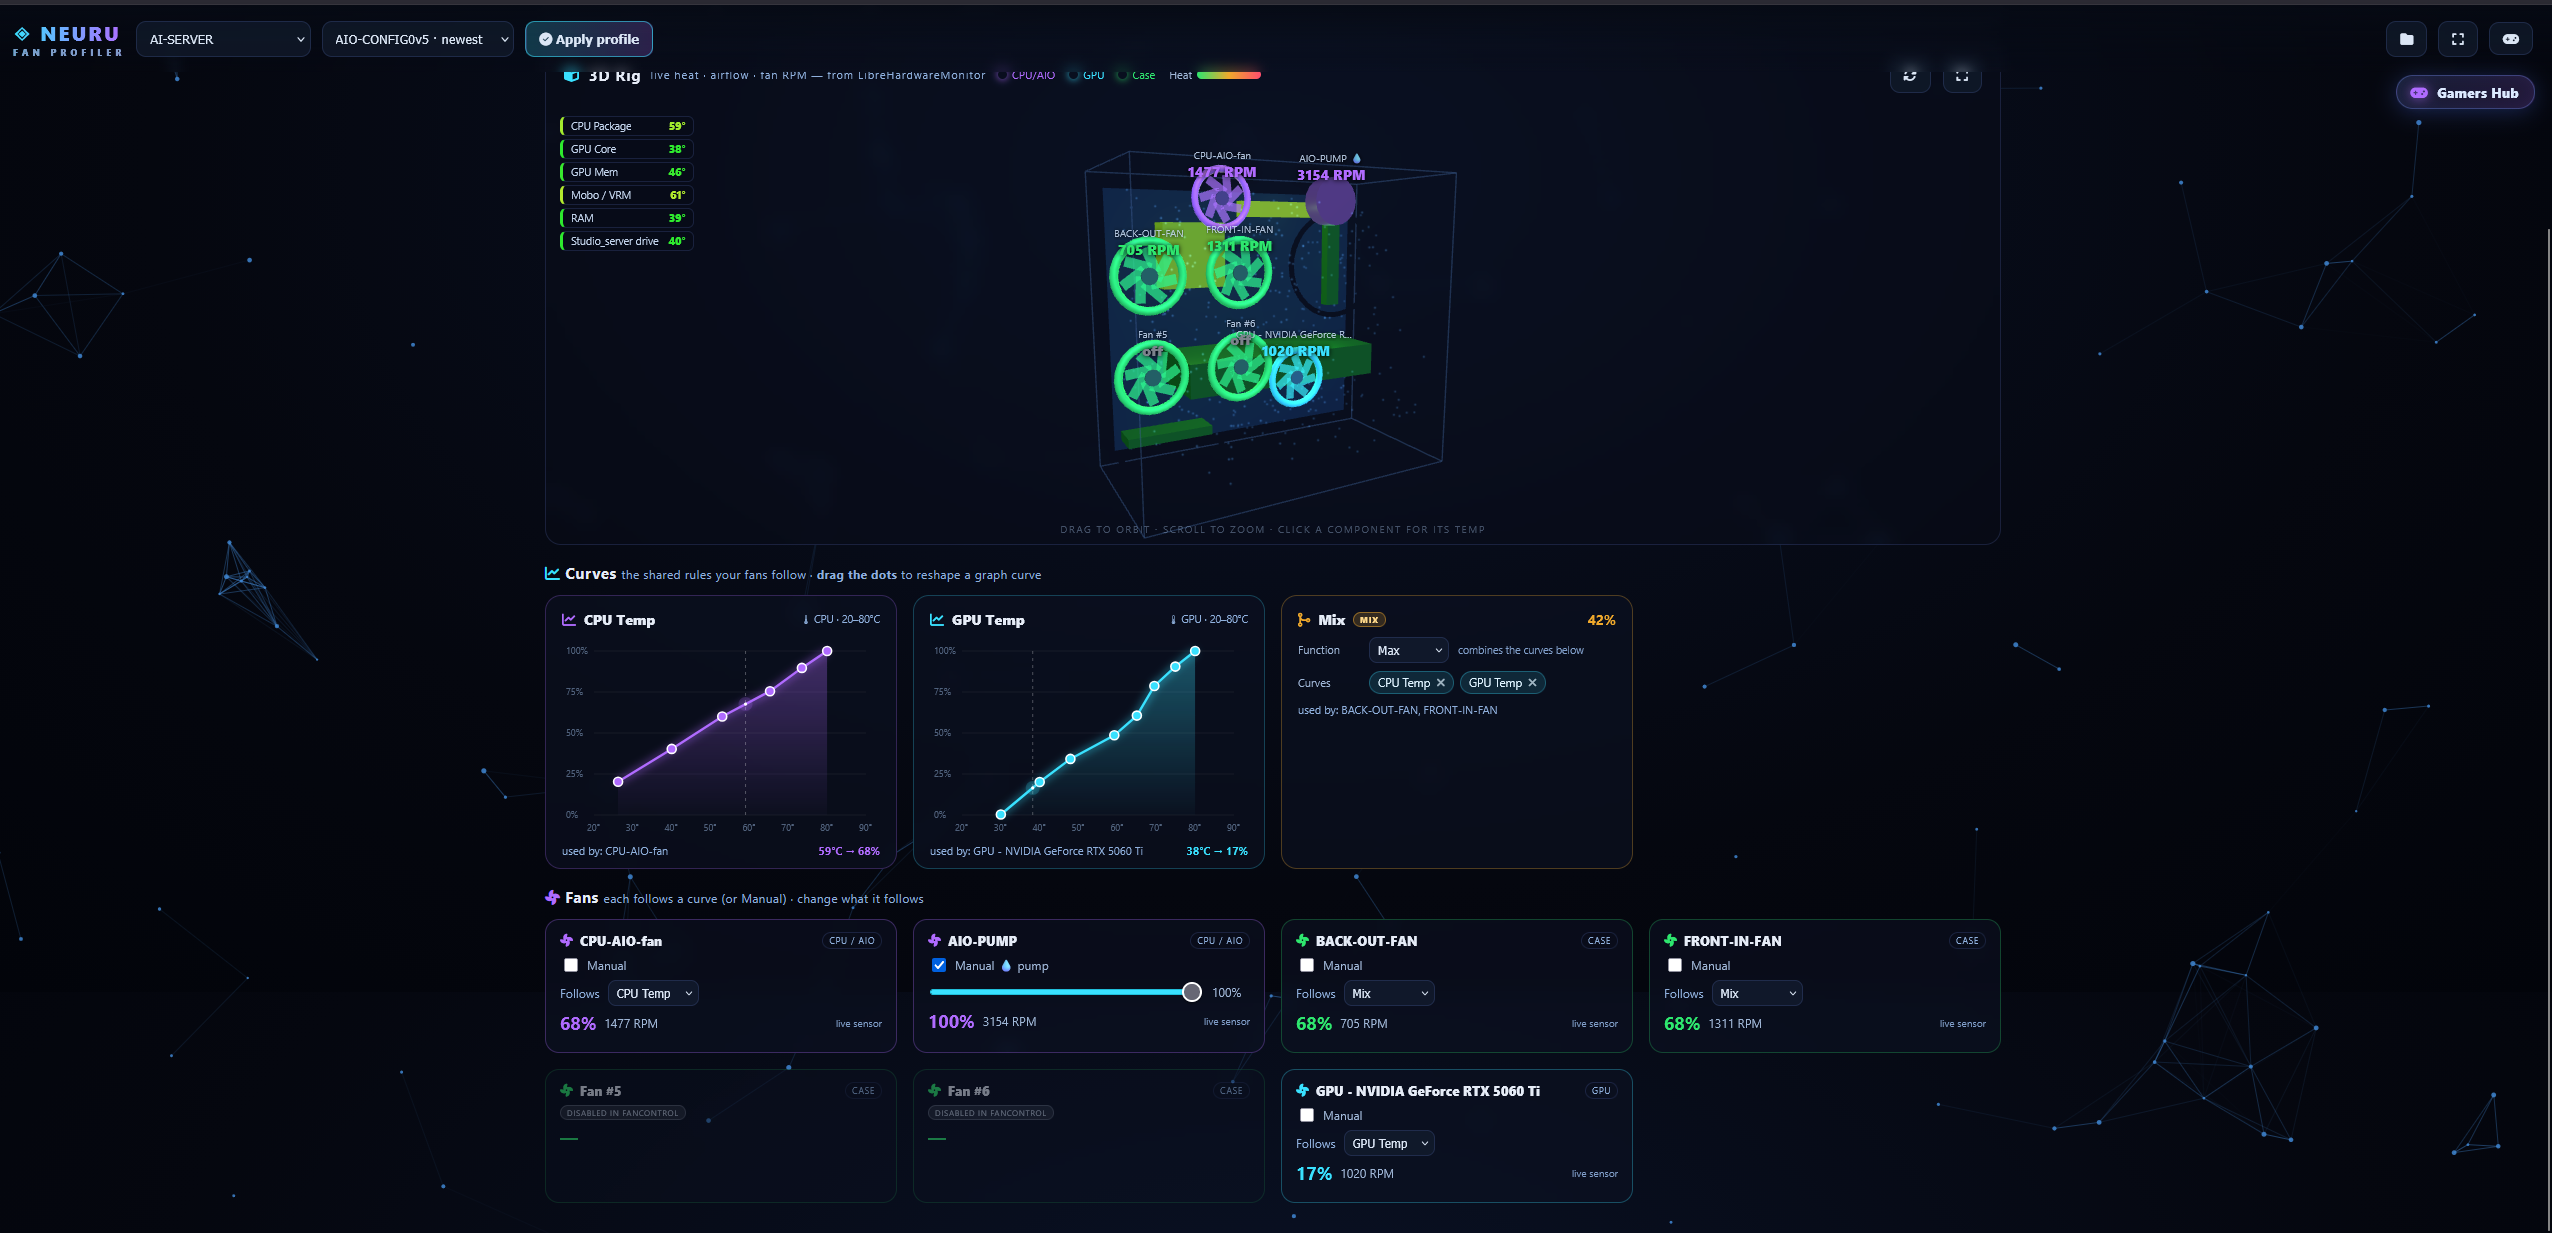
Fan Profiler
Tune your FanControl curves without alt-tabbing out of the game. NEURU reads, edits and switches your FanControl config files over SSH, draws each fan’s curve with the live temperature marked, and previews Cooler / Quiet presets before you apply.
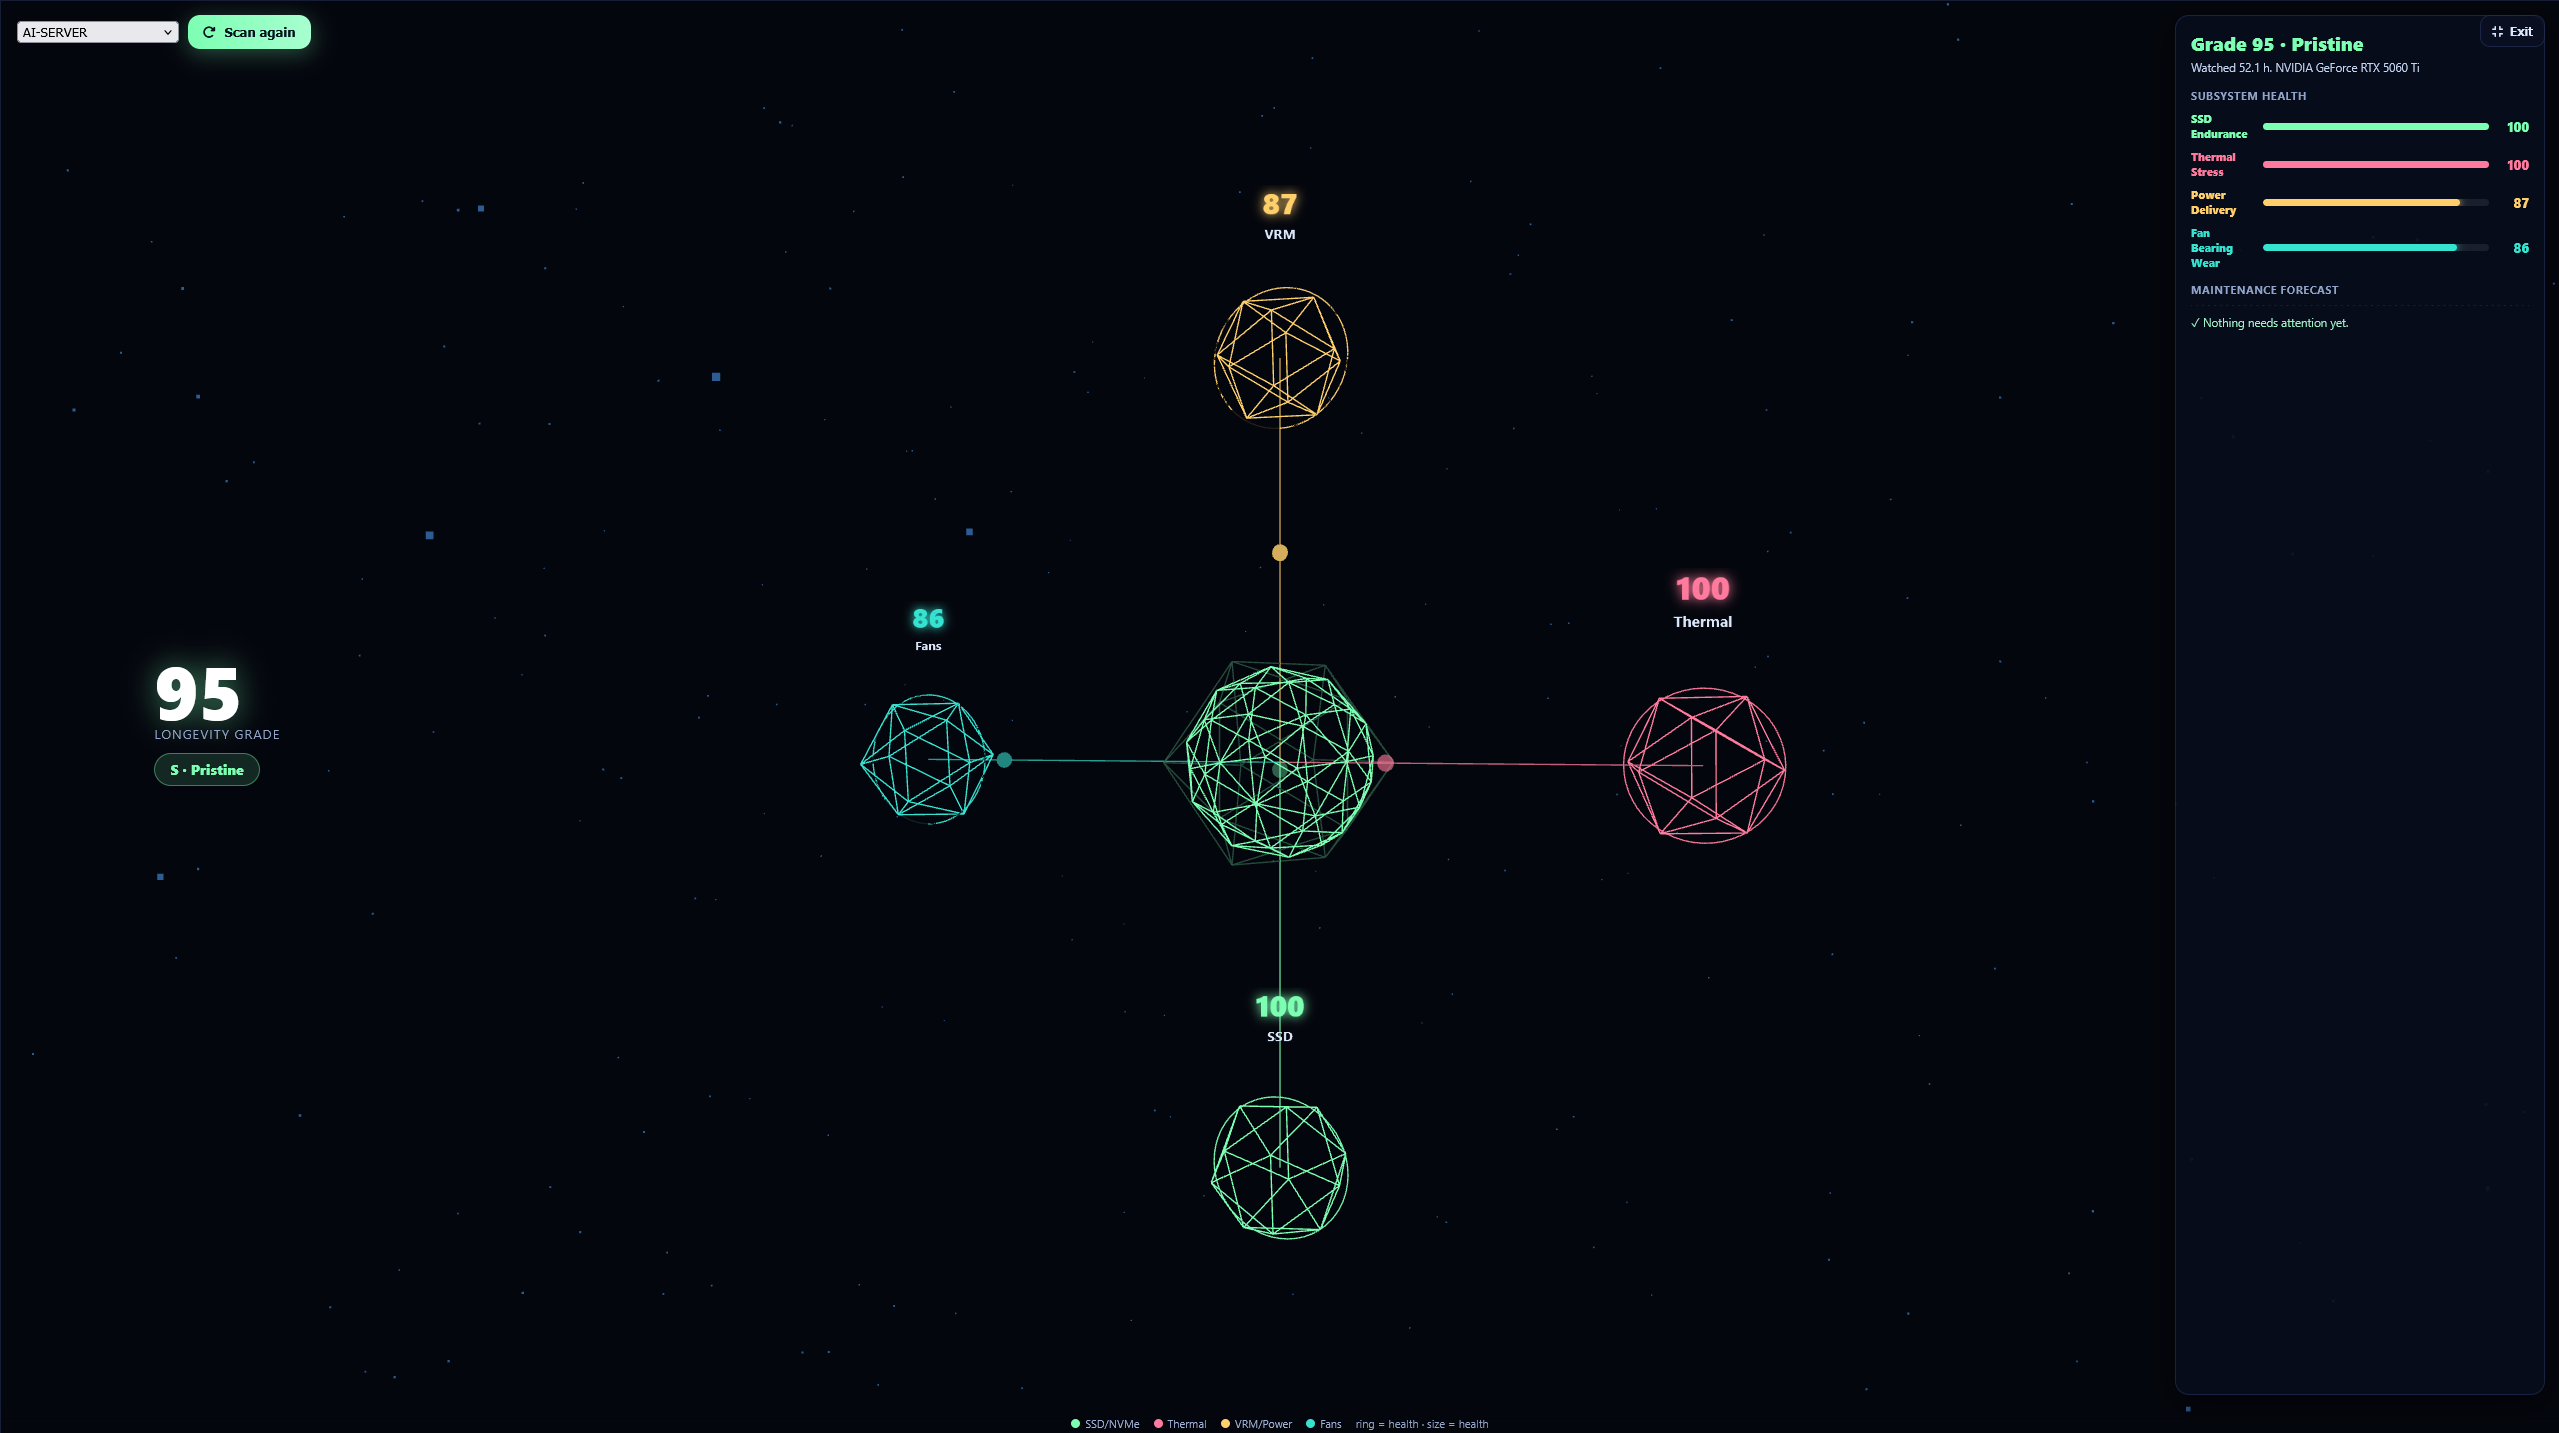
Hardware Longevity
A cumulative wear & lifespan view of your rig — real SSD/NVMe NAND endurance (SMART), thermal stress, VRM power-delivery stress and fan-bearing wear, accumulated over time and projected honestly. A central health core + subsystem gauges, a maintenance forecast, and a shareable rig health passport.
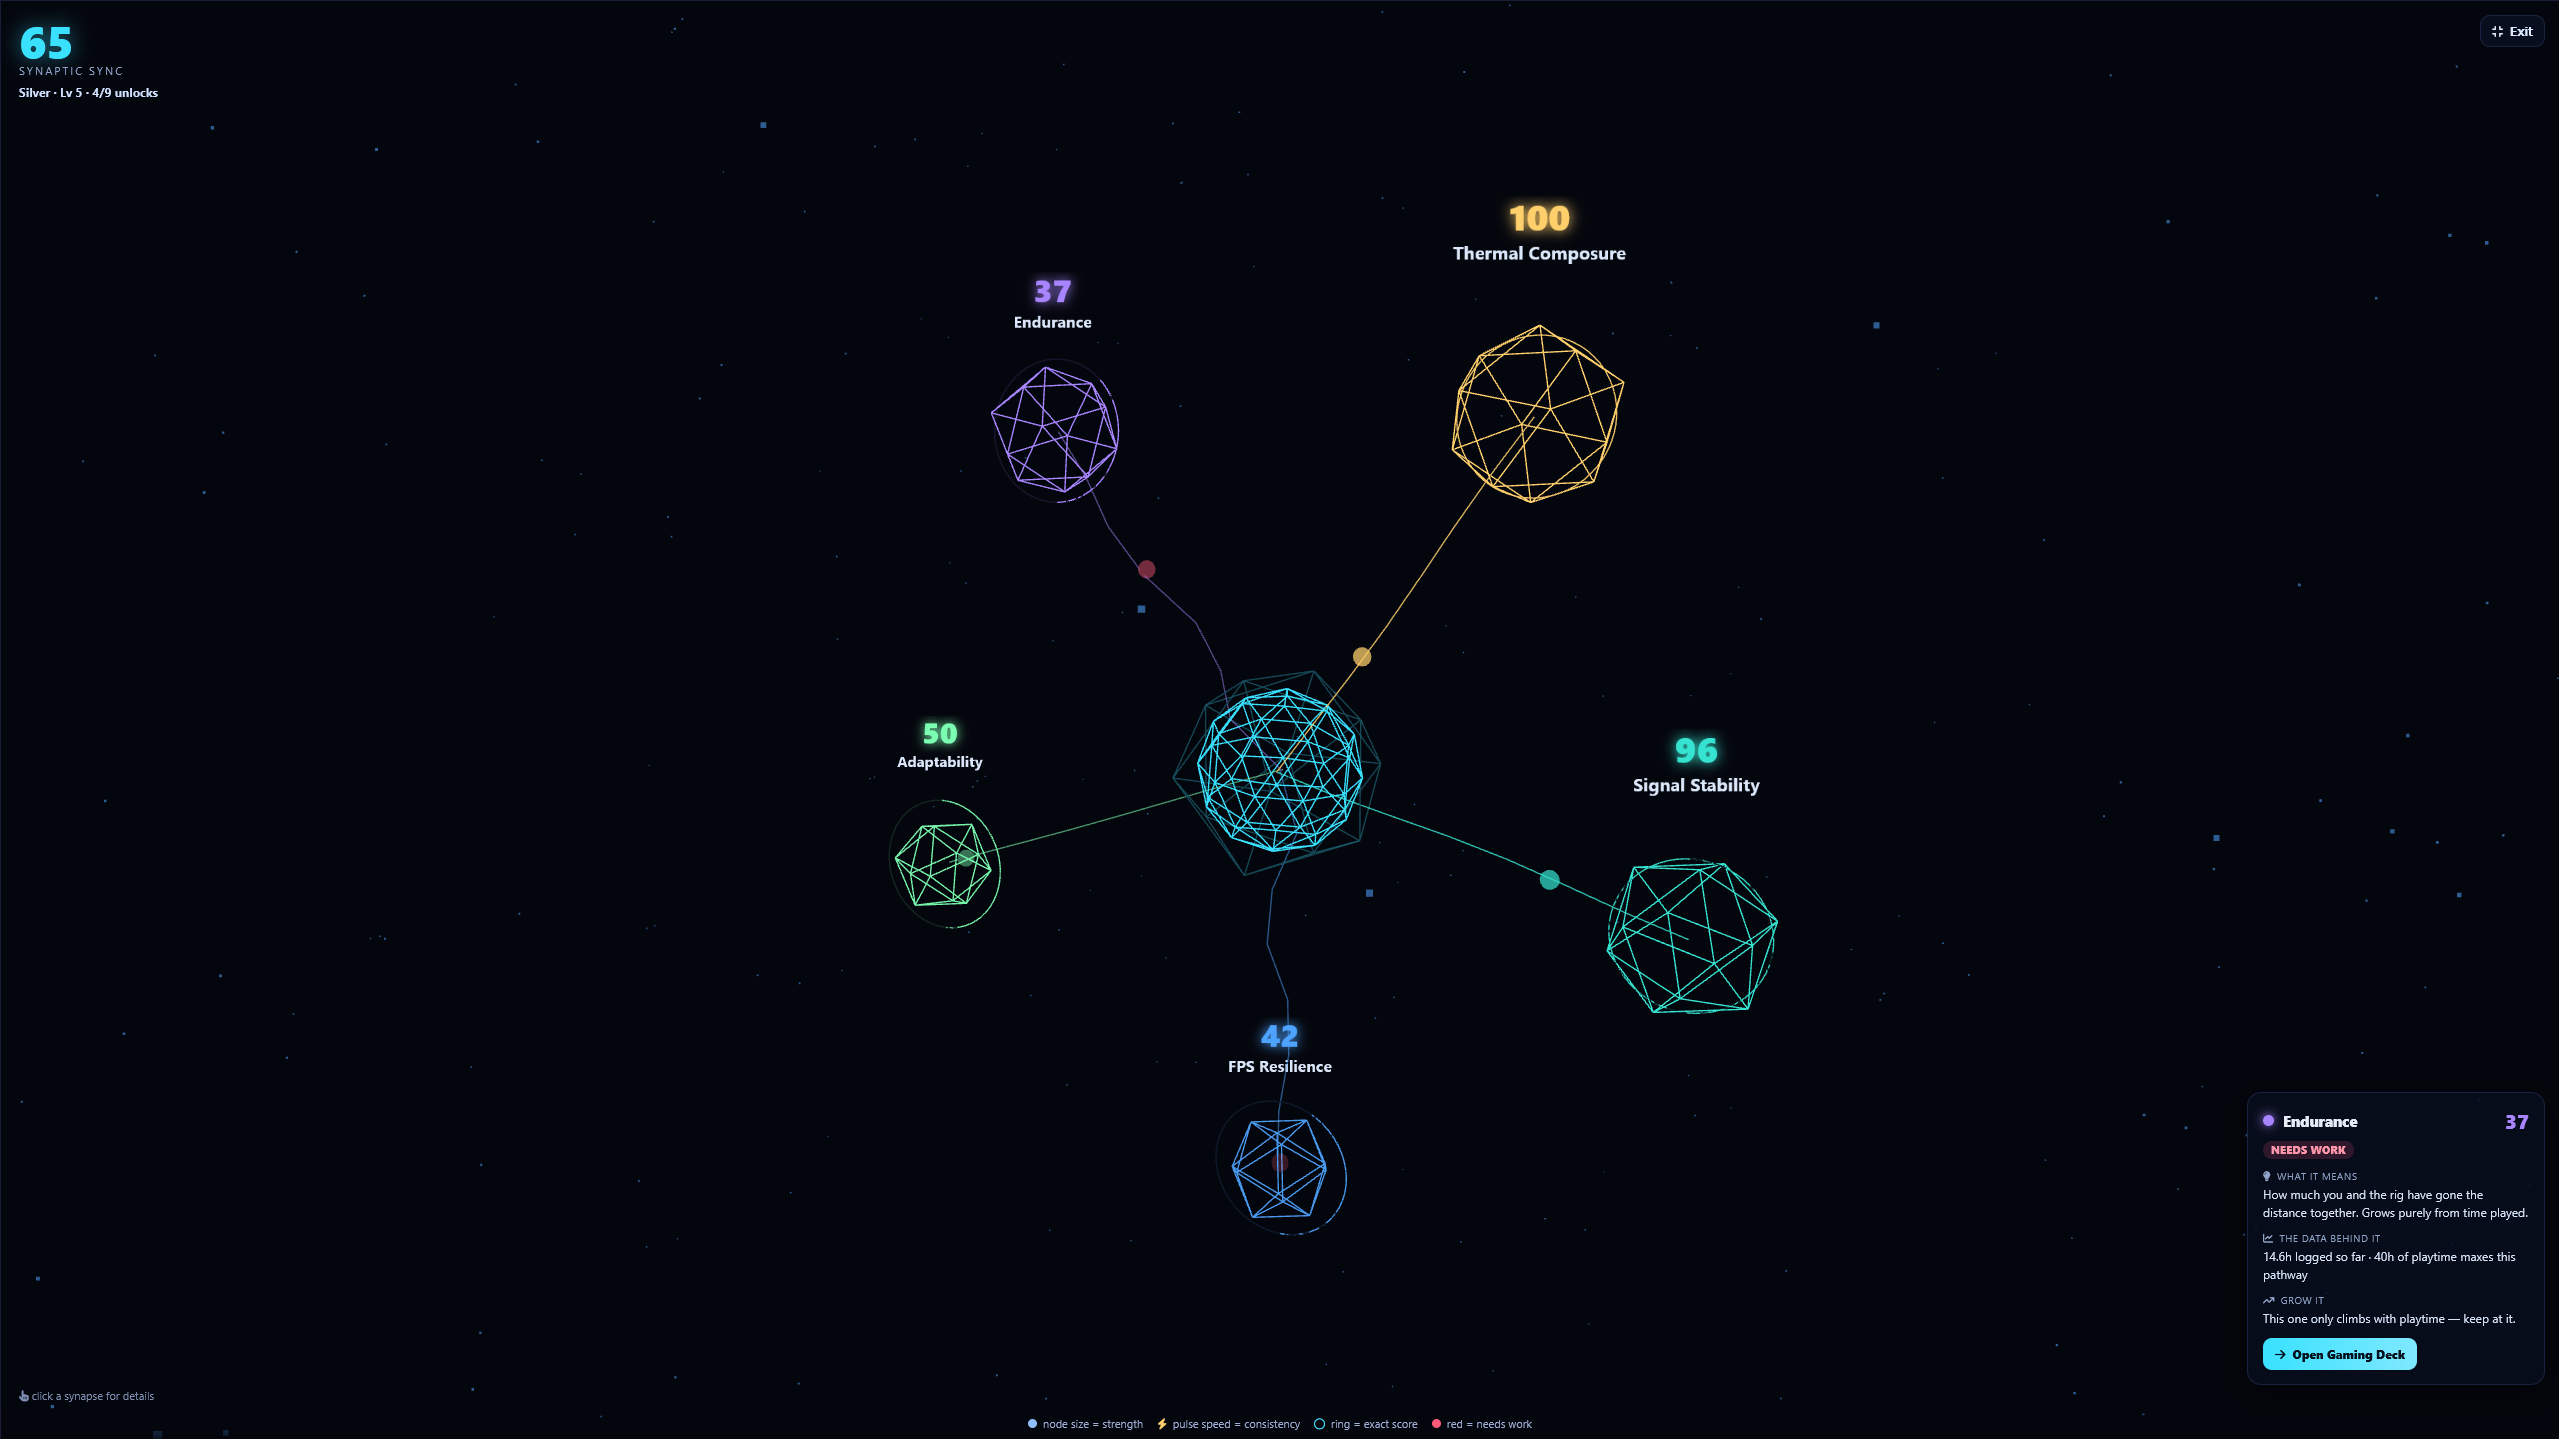
Synaptic Map
Your player↔machine symbiosis as a live 3D neural map: your real session history (frames, thermals, stability, endurance) forms “synaptic pathways”, scored into a Synaptic Sync Index with a shareable Cyborg Profile. Built on real telemetry — no made-up numbers.
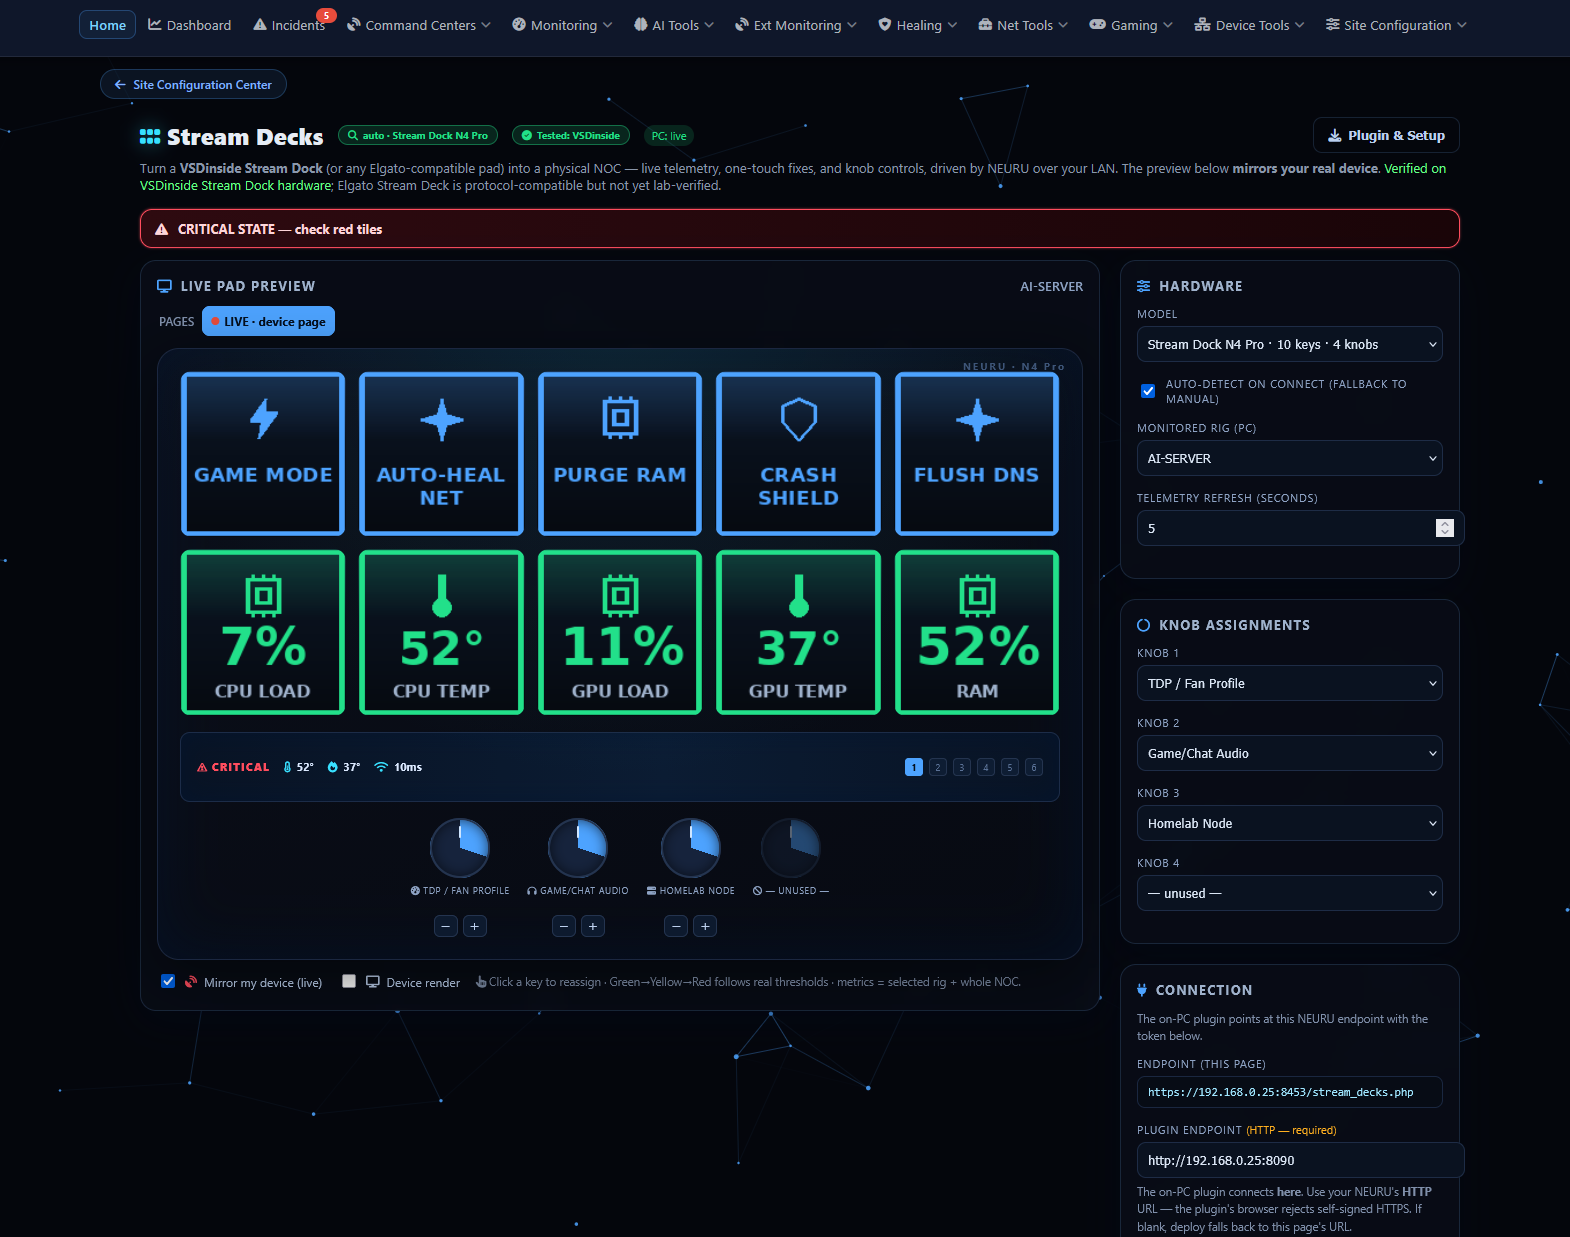
Stream Decks
Turn a VSDinside / Elgato Stream Deck into a physical control surface for your rig and your NOC — live tiles fed by NEURU (FPS, temps, alerts, one-tap actions) via an on-PC plugin over a secure token API.